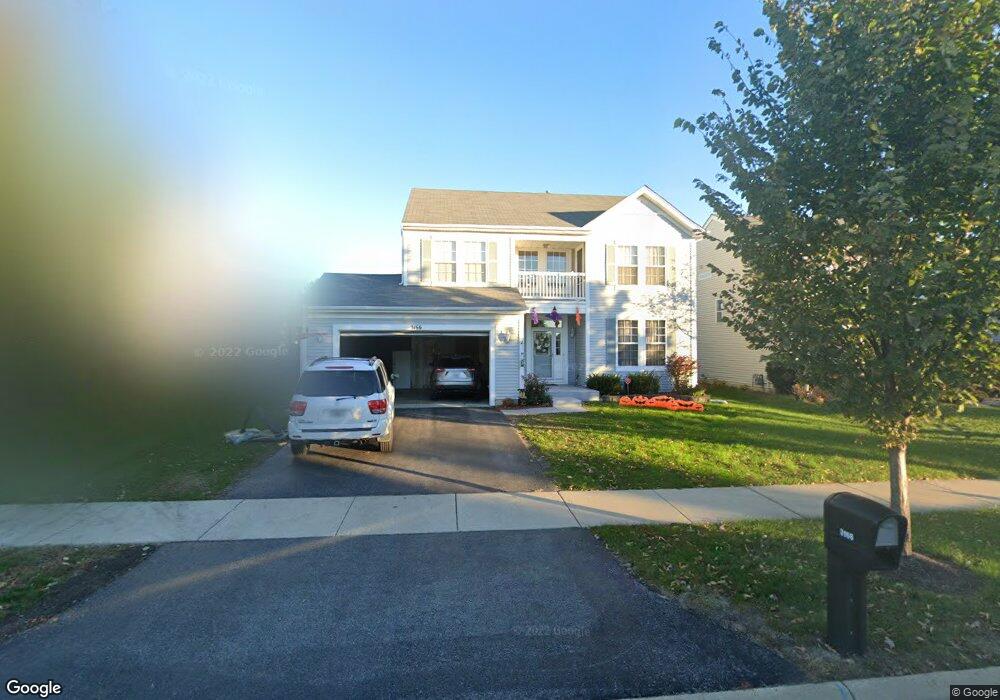
3166 Davey Ct Aurora, IL 60503
Far Southeast NeighborhoodEstimated Value: $453,691 - $522,000
4
Beds
3
Baths
2,474
Sq Ft
$195/Sq Ft
Est. Value
About This Home
This home is located at 3166 Davey Ct, Aurora, IL 60503 and is currently estimated at $482,173, approximately $194 per square foot. 3166 Davey Ct is a home located in Will County with nearby schools including Homestead Elementary School, Murphy Junior High School, and Oswego East High School.
Ownership History
Date
Name
Owned For
Owner Type
Purchase Details
Closed on
Oct 27, 2017
Sold by
Weiser Thomas G
Bought by
Castro Oscar and Castro Jasmine Del Carmen
Current Estimated Value
Home Financials for this Owner
Home Financials are based on the most recent Mortgage that was taken out on this home.
Original Mortgage
$270,630
Interest Rate
3.94%
Mortgage Type
New Conventional
Purchase Details
Closed on
Jun 18, 2009
Sold by
Rios Sylvia Y
Bought by
Weiser Thomas G
Purchase Details
Closed on
Aug 29, 2003
Sold by
Remington Crossing Llc
Bought by
Weiser Thomas G and Rios Silvia Y
Home Financials for this Owner
Home Financials are based on the most recent Mortgage that was taken out on this home.
Original Mortgage
$177,000
Interest Rate
3.87%
Mortgage Type
Purchase Money Mortgage
Create a Home Valuation Report for This Property
The Home Valuation Report is an in-depth analysis detailing your home's value as well as a comparison with similar homes in the area
Home Values in the Area
Average Home Value in this Area
Purchase History
| Date | Buyer | Sale Price | Title Company |
|---|---|---|---|
| Castro Oscar | $279,000 | Altima Title Llc | |
| Weiser Thomas G | -- | None Available | |
| Weiser Thomas G | $260,000 | First American Title |
Source: Public Records
Mortgage History
| Date | Status | Borrower | Loan Amount |
|---|---|---|---|
| Previous Owner | Castro Oscar | $270,630 | |
| Previous Owner | Weiser Thomas G | $177,000 |
Source: Public Records
Tax History
| Year | Tax Paid | Tax Assessment Tax Assessment Total Assessment is a certain percentage of the fair market value that is determined by local assessors to be the total taxable value of land and additions on the property. | Land | Improvement |
|---|---|---|---|---|
| 2024 | $10,640 | $130,072 | $23,259 | $106,813 |
| 2023 | $10,640 | $114,905 | $20,547 | $94,358 |
| 2022 | $9,658 | $103,053 | $19,437 | $83,616 |
| 2021 | $9,598 | $98,145 | $18,511 | $79,634 |
| 2020 | $9,189 | $96,590 | $18,218 | $78,372 |
| 2019 | $9,594 | $93,868 | $17,705 | $76,163 |
| 2018 | $8,950 | $85,176 | $17,315 | $67,861 |
| 2017 | $8,871 | $82,977 | $16,868 | $66,109 |
| 2016 | $8,787 | $81,191 | $16,505 | $64,686 |
| 2015 | $9,221 | $78,068 | $15,870 | $62,198 |
| 2014 | $9,221 | $77,890 | $13,380 | $64,510 |
| 2013 | $9,221 | $77,890 | $13,380 | $64,510 |
Source: Public Records
Map
Nearby Homes
- 3383 Fulshear Cir
- 3288 Wildlight Rd
- 3264 Oak Creek Ln
- 3252 Oak Creek Ln
- 2843 Hillcrest Cir
- 2735 Hillsboro Blvd Unit 3
- 2723 Hillsboro Blvd
- 9623 S Carls Dr
- 3138 Cambria Ct Unit 394
- 2233 Hillsboro Ct
- 2598 Hillsboro Blvd
- 2629 Camberley Cir
- 2255 Georgetown Cir
- 2113 Colonial St Unit 1
- 2615 Cranbrook St
- 10S154 Schoger Dr
- 2503 Bayhill Ct
- 2969 Francis Ct
- 3975 Idlewild Ln Unit 107
- 2662 Lahinch Dr
- 3156 Davey Ct
- 3176 Davey Ct
- 3146 Davey Ct
- 3186 Davey Ct
- 3136 Davey Ct
- 3163 Davey Ct
- 2179 Grayhawk Dr Unit 1
- 3196 Davey Ct
- 3153 Davey Ct
- 2175 Grayhawk Dr Unit 1
- 3173 Davey Ct
- 3143 Davey Ct
- 2186 Middlebury Dr
- 2172 Grayhawk Dr Unit 1
- 2182 Middlebury Dr Unit 1
- 3133 Davey Ct
- 2171 Grayhawk Dr
- 3206 Davey Ct
- 2168 Grayhawk Dr
- 3183 Davey Ct
Your Personal Tour Guide
Ask me questions while you tour the home.