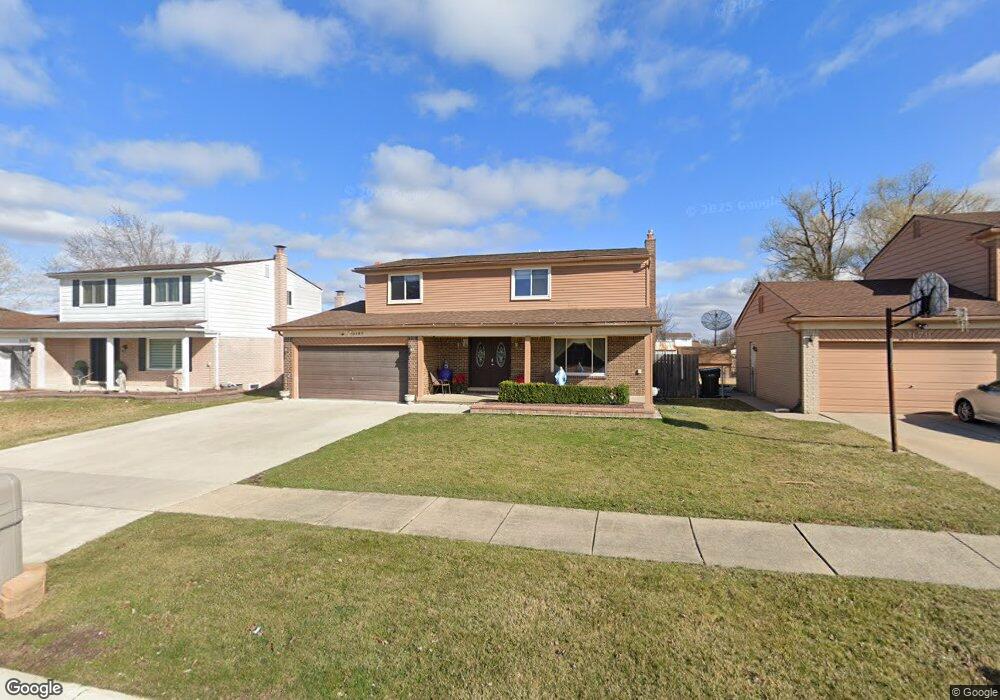
3167 Elmcrest Rd Sterling Heights, MI 48310
Estimated Value: $306,000 - $354,000
Studio
1
Bath
1,698
Sq Ft
$196/Sq Ft
Est. Value
About This Home
This home is located at 3167 Elmcrest Rd, Sterling Heights, MI 48310 and is currently estimated at $332,420, approximately $195 per square foot. 3167 Elmcrest Rd is a home located in Macomb County with nearby schools including Susick Elementary School, Grissom Middle School, and Sterling Heights Senior H.S..
Ownership History
Date
Name
Owned For
Owner Type
Purchase Details
Closed on
May 17, 2022
Sold by
Hana and Sahira
Bought by
Hana Goris and Hirmoz Sahira
Current Estimated Value
Purchase Details
Closed on
Jan 17, 2006
Sold by
Dabish Dhiya S and Mansour Rana
Bought by
Sahira Hana Gorgis and Sahira Hirmoz
Purchase Details
Closed on
Oct 11, 2005
Sold by
Mikha Ihssan and Mikha Suad
Bought by
Dabish Dhiya S
Purchase Details
Closed on
Mar 1, 2005
Sold by
Oza Mahesh and Oza Jashoda
Bought by
Mikha Ihssan
Home Financials for this Owner
Home Financials are based on the most recent Mortgage that was taken out on this home.
Original Mortgage
$132,000
Interest Rate
5.67%
Mortgage Type
Purchase Money Mortgage
Purchase Details
Closed on
Apr 9, 1998
Sold by
Patterson K S
Bought by
Oza M
Purchase Details
Closed on
Jul 15, 1996
Sold by
Sherevan N and Sherevan P
Bought by
Patterson K and Patterson S
Create a Home Valuation Report for This Property
The Home Valuation Report is an in-depth analysis detailing your home's value as well as a comparison with similar homes in the area
Home Values in the Area
Average Home Value in this Area
Purchase History
| Date | Buyer | Sale Price | Title Company |
|---|---|---|---|
| Hana Goris | -- | None Listed On Document | |
| Sahira Hana Gorgis | -- | None Available | |
| Dabish Dhiya S | $193,000 | -- | |
| Mikha Ihssan | $165,000 | Great Lakes Title Of Mi | |
| Oza M | $155,000 | -- | |
| Patterson K | $137,900 | -- |
Source: Public Records
Mortgage History
| Date | Status | Borrower | Loan Amount |
|---|---|---|---|
| Previous Owner | Mikha Ihssan | $132,000 |
Source: Public Records
Tax History
| Year | Tax Paid | Tax Assessment Tax Assessment Total Assessment is a certain percentage of the fair market value that is determined by local assessors to be the total taxable value of land and additions on the property. | Land | Improvement |
|---|---|---|---|---|
| 2025 | $3,617 | $162,400 | $0 | $0 |
| 2024 | $34 | $152,900 | $0 | $0 |
| 2023 | $3,271 | $137,300 | $0 | $0 |
| 2022 | $3,172 | $121,400 | $0 | $0 |
| 2021 | $3,278 | $113,600 | $0 | $0 |
| 2020 | $3,116 | $106,800 | $0 | $0 |
| 2019 | $2,925 | $97,800 | $0 | $0 |
| 2018 | $3,100 | $88,300 | $0 | $0 |
| 2017 | $2,989 | $82,800 | $15,600 | $67,200 |
| 2016 | $2,925 | $82,800 | $0 | $0 |
| 2015 | -- | $76,400 | $0 | $0 |
| 2014 | -- | $63,600 | $0 | $0 |
Source: Public Records
Map
Nearby Homes
- 35755 Connecticut Dr
- 3650 Veronica Dr
- 36217 Jeffrey Dr
- 36310 Park Place Dr
- 36268 Jeffrey Dr
- 3806 Partagas Dr Unit 48
- 36311 Park Place Dr
- 2448 Oakcrest Rd
- 36236 Arlene Dr
- 36850 English Dr
- 2106 Oakcrest Rd
- 2235 Chesley Dr
- 4111 Rose Mary Dr
- 4215 Nickolas Dr
- 4116 April Ln Unit 24
- 36117 Del Ray Dr
- 4274 Dickson Dr
- 35851 Thornton Dr
- 37183 Curwood Dr
- 2995 Groves Dr
- 3155 Elmcrest Rd
- 3179 Elmcrest Rd
- 3143 Elmcrest Rd
- 3311 Elmcrest Rd
- 35849 Shell Dr
- 3131 Elmcrest Rd
- 3323 Elmcrest Rd
- 3154 Elmcrest Rd
- 3142 Elmcrest Rd
- 3119 Elmcrest Rd
- 3335 Elmcrest Rd
- 35835 Shell Dr
- 35850 Shell Dr
- 3130 Elmcrest Rd
- 3347 Elmcrest Rd
- 3107 Elmcrest Rd
- 35823 Shell Dr
- 35836 Shell Dr
- 3118 Elmcrest Rd
- 35877 Connecticut Dr
Your Personal Tour Guide
Ask me questions while you tour the home.