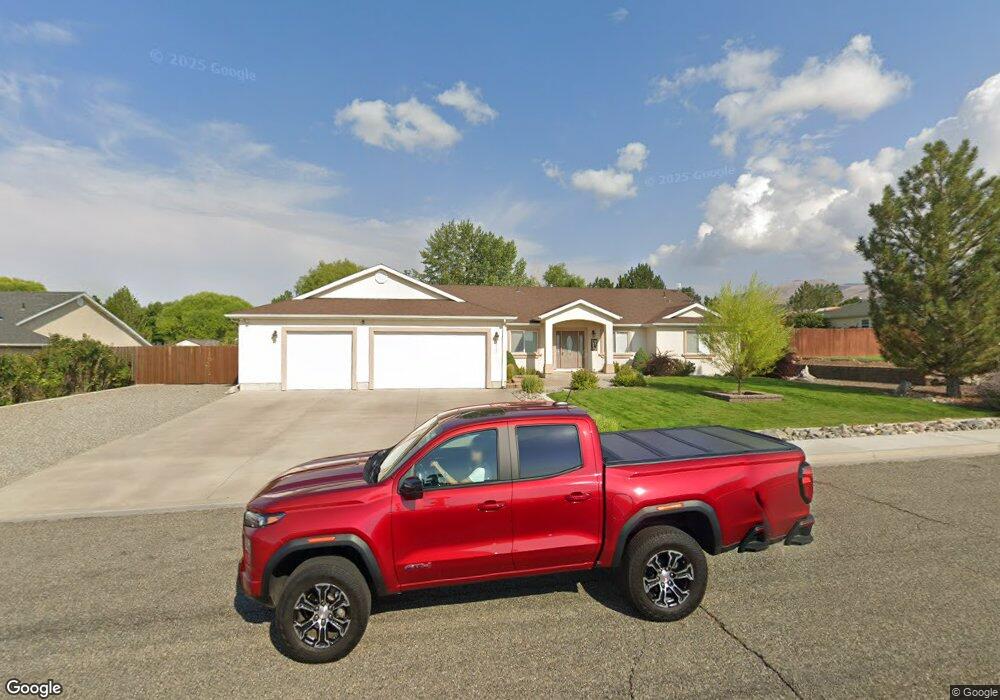
3167 Frontier St Winnemucca, NV 89445
Estimated Value: $583,085 - $638,000
4
Beds
3
Baths
2,621
Sq Ft
$232/Sq Ft
Est. Value
About This Home
This home is located at 3167 Frontier St, Winnemucca, NV 89445 and is currently estimated at $608,771, approximately $232 per square foot. 3167 Frontier St is a home located in Humboldt County with nearby schools including Sonoma Heights Elementary School, French Ford Middle School, and Winnemucca Junior High School.
Ownership History
Date
Name
Owned For
Owner Type
Purchase Details
Closed on
May 25, 2006
Sold by
Sharing Echeverria Profit
Bought by
Rorex Joseph A and Rorex Zwaantje T
Current Estimated Value
Home Financials for this Owner
Home Financials are based on the most recent Mortgage that was taken out on this home.
Original Mortgage
$22,468
Interest Rate
6.56%
Purchase Details
Closed on
Mar 10, 2005
Sold by
Echeverria Profit Sharing Plan
Bought by
Nevada Bell Telephone Company and Sbc Nevada
Create a Home Valuation Report for This Property
The Home Valuation Report is an in-depth analysis detailing your home's value as well as a comparison with similar homes in the area
Home Values in the Area
Average Home Value in this Area
Purchase History
| Date | Buyer | Sale Price | Title Company |
|---|---|---|---|
| Rorex Joseph A | -- | First American Title | |
| Nevada Bell Telephone Company | -- | -- |
Source: Public Records
Mortgage History
| Date | Status | Borrower | Loan Amount |
|---|---|---|---|
| Closed | Rorex Joseph A | $22,468 | |
| Open | Rorex Joseph A | $215,495 |
Source: Public Records
Tax History Compared to Growth
Tax History
| Year | Tax Paid | Tax Assessment Tax Assessment Total Assessment is a certain percentage of the fair market value that is determined by local assessors to be the total taxable value of land and additions on the property. | Land | Improvement |
|---|---|---|---|---|
| 2025 | $4,128 | $140,816 | $20,475 | $120,341 |
| 2024 | $3,958 | $139,721 | $20,475 | $119,246 |
| 2023 | $3,958 | $130,718 | $19,775 | $110,943 |
| 2022 | $3,737 | $114,428 | $19,775 | $94,653 |
| 2021 | $3,715 | $113,726 | $19,775 | $93,951 |
| 2020 | $3,648 | $115,521 | $19,775 | $95,746 |
| 2019 | $3,430 | $106,501 | $19,775 | $86,726 |
| 2018 | $3,333 | $101,688 | $15,575 | $86,113 |
| 2017 | $3,330 | $101,599 | $15,575 | $86,024 |
| 2016 | $3,389 | $103,188 | $15,575 | $87,613 |
| 2015 | $3,132 | $102,208 | $15,575 | $86,633 |
| 2014 | $3,132 | $100,220 | $15,575 | $84,645 |
Source: Public Records
Map
Nearby Homes
- 3271 Paiute St
- 2948 Paiute St
- 3350 Frontier St
- 5416 Branding Iron Way Unit 24
- 10-0149-02 Kluncy Canyon Rd
- 5198 Western Way
- 3200 Kensington Dr
- 5305 Marla Dr Unit 5
- 5320 Marla Dr Unit 19
- 5295 Marla Dr Unit 4
- 5310 Marla Dr Unit 18
- 5285 Marla Dr Unit 3
- 5280 Marla Dr Unit 15
- Lot 16059313 Offenhauser Dr
- Lot 16059212 Offenhauser Dr
- Lot 16059312 Offenhauser Dr
- Lot 16059303 Offenhauser Dr
- Lot 16059209 Offenhauser Dr
- Lot 16059217 Offenhauser Dr
- Lot 16059301 Offenhauser Dr
- 3193 Frontier St
- 3145 Frontier St
- 3164 Paiute St
- 3142 Paiute St
- 3123 Frontier St
- 3166 Frontier St
- 3046 Frontier St
- 5580 Palisade Dr
- 3078 Frontier St
- 5680 Palisade Dr
- 3140 Frontier St
- 5605 Palisade Dr
- 3126 Paiute St
- 16034158 Paiute St
- 16034160 Paiute St
- 15409 Paiute Trail
- 15404 Paiute
- 15403 Paiute
- 3128 Frontier St
- 3202 Paiute St