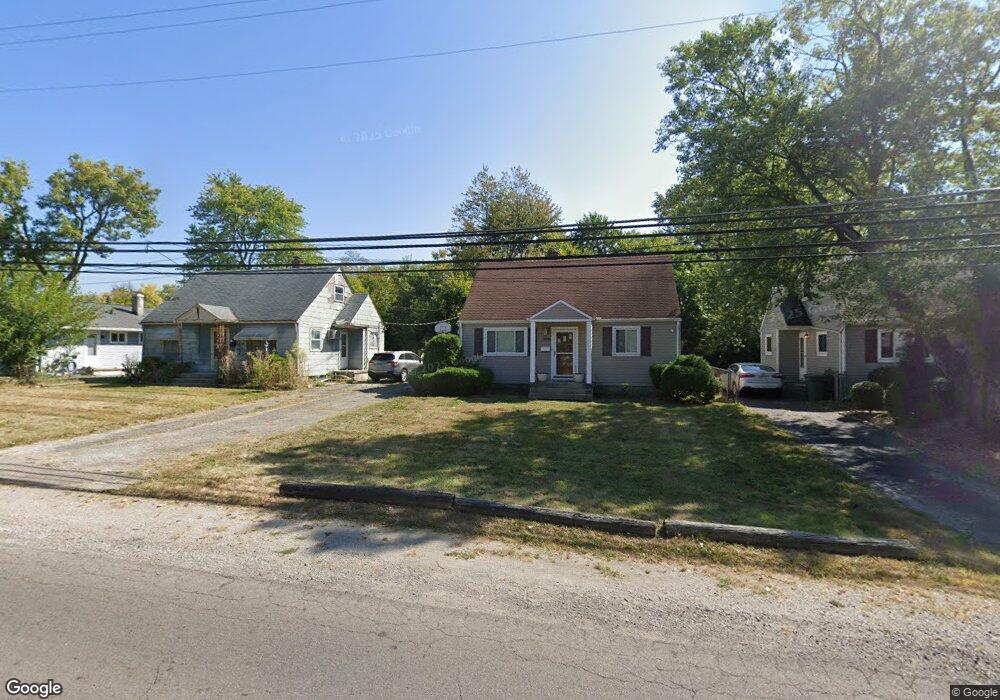
3168 Reis Ave Columbus, OH 43224
North Linden NeighborhoodEstimated Value: $167,417 - $242,000
3
Beds
1
Bath
1,016
Sq Ft
$202/Sq Ft
Est. Value
About This Home
This home is located at 3168 Reis Ave, Columbus, OH 43224 and is currently estimated at $204,854, approximately $201 per square foot. 3168 Reis Ave is a home located in Franklin County with nearby schools including Como Elementary School, Dominion Middle School, and Whetstone High School.
Ownership History
Date
Name
Owned For
Owner Type
Purchase Details
Closed on
May 10, 2002
Sold by
Grinko Paula M and Walker Paula M
Bought by
Grinko Michael E
Current Estimated Value
Home Financials for this Owner
Home Financials are based on the most recent Mortgage that was taken out on this home.
Original Mortgage
$64,000
Outstanding Balance
$32,019
Interest Rate
9.62%
Estimated Equity
$172,835
Purchase Details
Closed on
Jun 26, 1996
Sold by
Garrett Jonathan M
Bought by
Grinko Michael E and Grinko Paula M
Home Financials for this Owner
Home Financials are based on the most recent Mortgage that was taken out on this home.
Original Mortgage
$55,350
Interest Rate
8.13%
Mortgage Type
Balloon
Purchase Details
Closed on
Aug 12, 1994
Sold by
Turner William E
Bought by
Jonathan M Garrett
Home Financials for this Owner
Home Financials are based on the most recent Mortgage that was taken out on this home.
Original Mortgage
$52,965
Interest Rate
8.62%
Mortgage Type
New Conventional
Purchase Details
Closed on
Mar 22, 1994
Create a Home Valuation Report for This Property
The Home Valuation Report is an in-depth analysis detailing your home's value as well as a comparison with similar homes in the area
Home Values in the Area
Average Home Value in this Area
Purchase History
| Date | Buyer | Sale Price | Title Company |
|---|---|---|---|
| Grinko Michael E | -- | -- | |
| Grinko Michael E | $61,500 | -- | |
| Jonathan M Garrett | $54,000 | -- | |
| -- | $40,000 | -- |
Source: Public Records
Mortgage History
| Date | Status | Borrower | Loan Amount |
|---|---|---|---|
| Open | Grinko Michael E | $64,000 | |
| Closed | Grinko Michael E | $55,350 | |
| Previous Owner | Jonathan M Garrett | $52,965 |
Source: Public Records
Tax History Compared to Growth
Tax History
| Year | Tax Paid | Tax Assessment Tax Assessment Total Assessment is a certain percentage of the fair market value that is determined by local assessors to be the total taxable value of land and additions on the property. | Land | Improvement |
|---|---|---|---|---|
| 2024 | $2,328 | $51,870 | $15,820 | $36,050 |
| 2023 | $2,298 | $51,870 | $15,820 | $36,050 |
| 2022 | $1,629 | $31,400 | $7,320 | $24,080 |
| 2021 | $1,631 | $31,400 | $7,320 | $24,080 |
| 2020 | $1,634 | $31,400 | $7,320 | $24,080 |
| 2019 | $1,614 | $26,600 | $6,090 | $20,510 |
| 2018 | $1,417 | $26,600 | $6,090 | $20,510 |
| 2017 | $1,613 | $26,600 | $6,090 | $20,510 |
| 2016 | $1,347 | $20,340 | $4,100 | $16,240 |
| 2015 | $1,223 | $20,340 | $4,100 | $16,240 |
| 2014 | $1,226 | $20,340 | $4,100 | $16,240 |
| 2013 | $671 | $22,575 | $4,550 | $18,025 |
Source: Public Records
Map
Nearby Homes
- 826 E Brighton Rd
- 788 E Brighton Rd
- 759 E Longview Ave
- 3087 Hiawatha St
- 3105 Atwood Terrace
- 2923 Azelda St
- 612 E Como Ave
- 2996 Atwood Terrace
- 775 E Weber Rd
- 3476 Beulah Rd
- 1120 Piedmont Rd
- 3480 Maize Rd
- 2899 Howey Rd
- 1126 Piedmont Rd
- 3129 McGuffey Rd
- 2816 Azelda St
- 2888 Howey Rd
- 2810-2812 Azelda St
- 2950 Grasmere Ave
- 876 Lenore Ave
- 3174 Reis Ave
- 3160 Reis Ave
- 3154 Reis Ave
- 3186 Reis Ave
- 3148 Reis Ave
- 847 Eddystone Ave
- 835 Eddystone Ave
- 3163 Maize Rd
- 3163 Maize Rd
- 3192 Reis Ave
- 3149 Maize Rd Unit 151
- 3142 Reis Ave
- 3151 Maize Rd
- 3169 Maize Rd Unit 171
- 827 Eddystone Ave
- 3143 Maize Rd Unit 145
- 3175 Maize Rd Unit 177
- 3137 Maize Rd Unit 139
- 838 Eddystone Ave
- 3136 Reis Ave