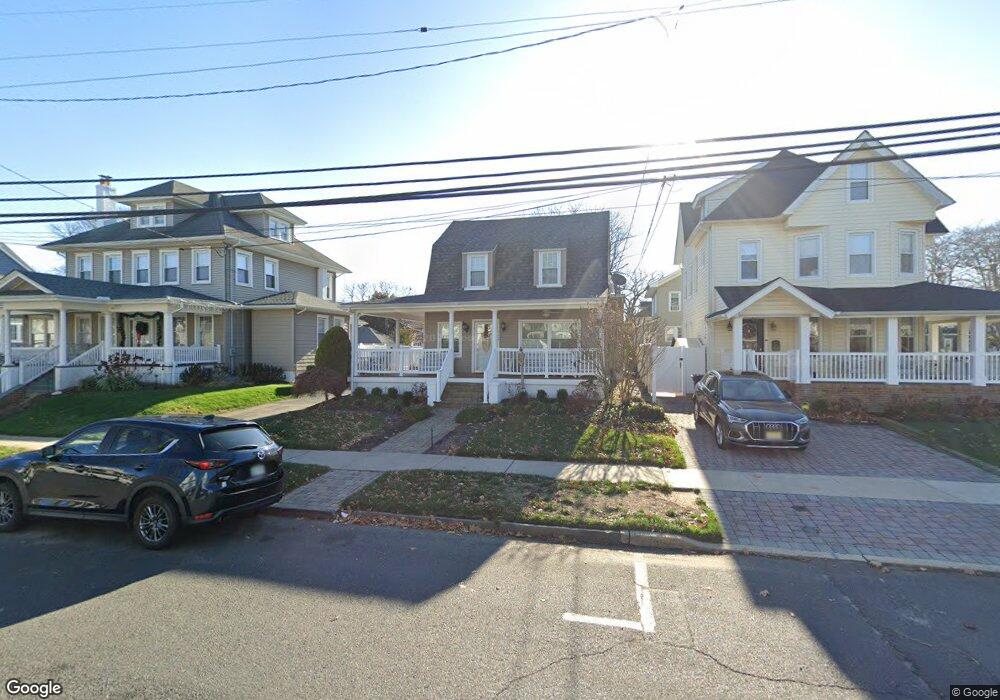
317 9th Ave Belmar, NJ 07719
Estimated Value: $1,220,000 - $1,481,000
5
Beds
2
Baths
1,920
Sq Ft
$696/Sq Ft
Est. Value
About This Home
This home is located at 317 9th Ave, Belmar, NJ 07719 and is currently estimated at $1,336,989, approximately $696 per square foot. 317 9th Ave is a home located in Monmouth County with nearby schools including Belmar Elementary School, St. Rose Grammar School, and St Rose High School.
Ownership History
Date
Name
Owned For
Owner Type
Purchase Details
Closed on
May 5, 2006
Sold by
Popyer Cathy
Bought by
Begane Joanne
Current Estimated Value
Home Financials for this Owner
Home Financials are based on the most recent Mortgage that was taken out on this home.
Original Mortgage
$549,600
Outstanding Balance
$327,749
Interest Rate
7.12%
Mortgage Type
Adjustable Rate Mortgage/ARM
Estimated Equity
$1,009,240
Purchase Details
Closed on
Sep 3, 2000
Sold by
Wien Phyllis
Bought by
Wien Phyllis and Popyer Cathy
Create a Home Valuation Report for This Property
The Home Valuation Report is an in-depth analysis detailing your home's value as well as a comparison with similar homes in the area
Home Values in the Area
Average Home Value in this Area
Purchase History
| Date | Buyer | Sale Price | Title Company |
|---|---|---|---|
| Begane Joanne | $687,000 | -- | |
| Wien Phyllis | -- | -- |
Source: Public Records
Mortgage History
| Date | Status | Borrower | Loan Amount |
|---|---|---|---|
| Open | Begane Joanne | $549,600 |
Source: Public Records
Tax History
| Year | Tax Paid | Tax Assessment Tax Assessment Total Assessment is a certain percentage of the fair market value that is determined by local assessors to be the total taxable value of land and additions on the property. | Land | Improvement |
|---|---|---|---|---|
| 2025 | $10,265 | $705,500 | $550,000 | $155,500 |
| 2024 | $9,919 | $705,500 | $550,000 | $155,500 |
| 2023 | $9,919 | $705,500 | $550,000 | $155,500 |
| 2022 | $9,674 | $712,900 | $550,000 | $162,900 |
| 2021 | $9,674 | $712,900 | $550,000 | $162,900 |
| 2020 | $9,589 | $712,900 | $550,000 | $162,900 |
| 2019 | $9,589 | $712,900 | $550,000 | $162,900 |
| 2018 | $8,804 | $712,900 | $550,000 | $162,900 |
| 2017 | $8,590 | $712,900 | $550,000 | $162,900 |
| 2016 | $7,539 | $394,500 | $260,000 | $134,500 |
| 2015 | $7,187 | $374,500 | $240,000 | $134,500 |
| 2014 | $6,860 | $354,500 | $220,000 | $134,500 |
Source: Public Records
Map
Nearby Homes
Your Personal Tour Guide
Ask me questions while you tour the home.