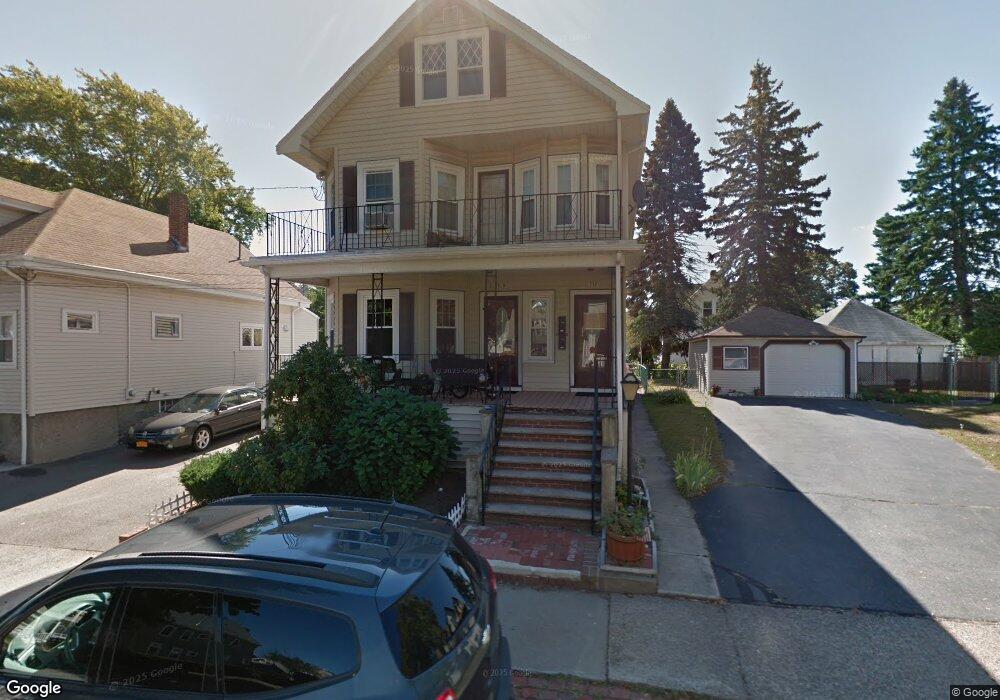
317 Atlantic St Quincy, MA 02171
Estimated Value: $971,000 - $1,073,000
4
Beds
2
Baths
2,398
Sq Ft
$435/Sq Ft
Est. Value
About This Home
This home is located at 317 Atlantic St, Quincy, MA 02171 and is currently estimated at $1,042,458, approximately $434 per square foot. 317 Atlantic St is a home located in Norfolk County with nearby schools including Squantum Elementary School, Atlantic Middle School, and North Quincy High School.
Ownership History
Date
Name
Owned For
Owner Type
Purchase Details
Closed on
May 27, 2004
Sold by
Jonaitis Helbert J and Jonaitis Marilyn E
Bought by
Allen Robert J
Current Estimated Value
Home Financials for this Owner
Home Financials are based on the most recent Mortgage that was taken out on this home.
Original Mortgage
$399,900
Outstanding Balance
$193,911
Interest Rate
5.88%
Mortgage Type
Purchase Money Mortgage
Estimated Equity
$848,547
Create a Home Valuation Report for This Property
The Home Valuation Report is an in-depth analysis detailing your home's value as well as a comparison with similar homes in the area
Home Values in the Area
Average Home Value in this Area
Purchase History
| Date | Buyer | Sale Price | Title Company |
|---|---|---|---|
| Allen Robert J | $499,900 | -- |
Source: Public Records
Mortgage History
| Date | Status | Borrower | Loan Amount |
|---|---|---|---|
| Open | Allen Robert J | $399,900 |
Source: Public Records
Tax History Compared to Growth
Tax History
| Year | Tax Paid | Tax Assessment Tax Assessment Total Assessment is a certain percentage of the fair market value that is determined by local assessors to be the total taxable value of land and additions on the property. | Land | Improvement |
|---|---|---|---|---|
| 2025 | $10,724 | $930,100 | $329,600 | $600,500 |
| 2024 | $10,277 | $911,900 | $329,600 | $582,300 |
| 2023 | $9,616 | $864,000 | $299,600 | $564,400 |
| 2022 | $9,287 | $775,200 | $239,700 | $535,500 |
| 2021 | $9,333 | $768,800 | $239,700 | $529,100 |
| 2020 | $9,185 | $738,900 | $235,000 | $503,900 |
| 2019 | $8,804 | $701,500 | $226,000 | $475,500 |
| 2018 | $8,309 | $622,900 | $215,200 | $407,700 |
| 2017 | $8,240 | $581,500 | $195,600 | $385,900 |
| 2016 | $7,329 | $510,400 | $177,900 | $332,500 |
| 2015 | $6,862 | $470,000 | $161,700 | $308,300 |
| 2014 | $6,017 | $404,900 | $161,700 | $243,200 |
Source: Public Records
Map
Nearby Homes
- 25 Hummock Rd
- 18 Hummock Rd
- 201 Billings St
- 77 Botolph St
- 185 Quincy Shore Dr Unit A28
- 165 Quincy Shore Dr Unit C63
- 1 Edwin St Unit C
- 94 Newbury Ave Unit 100
- 148 Quincy Shore Dr Unit 30
- 158 Quincy Shore Dr Unit 78
- 237 Billings Rd
- 90 Shore Ave
- 90 Quincy Shore Dr Unit 501
- 90 Quincy Shore Dr Unit 701
- 57 Quincy Shore Dr Unit 614
- 57 Quincy Shore Dr Unit PH South
- 133 Commander Shea Blvd Unit 219
- 133 Commander Shea Blvd Unit 506
- 133 Commander Shea Blvd Unit 215
- 133 Commander Shea Blvd Unit 315
- 319 Atlantic St Unit 2
- 317 Atlantic St Unit 317
- 311 Atlantic St
- 321 Atlantic St
- 52 Hovey St
- 323 Atlantic St
- 323 Atlantic St Unit 2
- 325 Atlantic St Unit 2
- 325 Atlantic St
- 323 Atlantic St Unit 1st
- 54 Hovey St
- 316 Atlantic St
- 48 Hovey St
- 58 Hovey St
- 329 Atlantic St Unit 1
- 327 Atlantic St
- 324 Atlantic St
- 312 Atlantic St
- 42 Hovey St
- 60 Hovey St