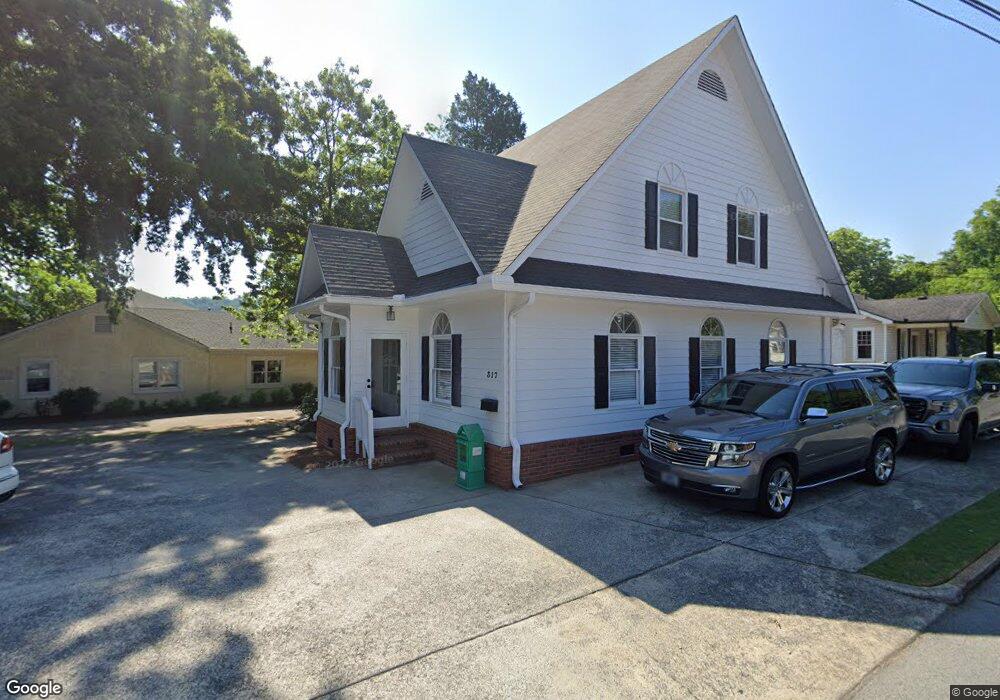
317 E Main St Cartersville, GA 30120
Estimated Value: $339,144 - $376,000
4
Beds
3
Baths
2,104
Sq Ft
$167/Sq Ft
Est. Value
About This Home
This home is located at 317 E Main St, Cartersville, GA 30120 and is currently estimated at $351,536, approximately $167 per square foot. 317 E Main St is a home located in Bartow County with nearby schools including Cartersville Primary School, Cartersville Elementary School, and Cartersville Middle School.
Ownership History
Date
Name
Owned For
Owner Type
Purchase Details
Closed on
May 8, 2013
Sold by
Hamilton State Bank
Bought by
Sellers James Anthony and Sellers Tammy C
Current Estimated Value
Home Financials for this Owner
Home Financials are based on the most recent Mortgage that was taken out on this home.
Original Mortgage
$139,925
Interest Rate
3.44%
Mortgage Type
New Conventional
Purchase Details
Closed on
Sep 4, 2012
Sold by
Clark Wyatt D
Bought by
Hamilton State Bank
Purchase Details
Closed on
Mar 28, 2007
Sold by
Dbh Development Inc
Bought by
Clark Wyatt D
Home Financials for this Owner
Home Financials are based on the most recent Mortgage that was taken out on this home.
Original Mortgage
$166,667
Interest Rate
6.15%
Mortgage Type
New Conventional
Purchase Details
Closed on
Jul 7, 2006
Sold by
Billy Boyd Enterprises Inc
Bought by
Dbh Development Inc
Create a Home Valuation Report for This Property
The Home Valuation Report is an in-depth analysis detailing your home's value as well as a comparison with similar homes in the area
Home Values in the Area
Average Home Value in this Area
Purchase History
| Date | Buyer | Sale Price | Title Company |
|---|---|---|---|
| Sellers James Anthony | $145,000 | -- | |
| Hamilton State Bank | $110,798 | -- | |
| Clark Wyatt D | $174,832 | -- | |
| Dbh Development Inc | $42,000 | -- |
Source: Public Records
Mortgage History
| Date | Status | Borrower | Loan Amount |
|---|---|---|---|
| Closed | Sellers James Anthony | $139,925 | |
| Previous Owner | Clark Wyatt D | $166,667 |
Source: Public Records
Tax History Compared to Growth
Tax History
| Year | Tax Paid | Tax Assessment Tax Assessment Total Assessment is a certain percentage of the fair market value that is determined by local assessors to be the total taxable value of land and additions on the property. | Land | Improvement |
|---|---|---|---|---|
| 2024 | $3,371 | $132,456 | $22,000 | $110,456 |
| 2023 | $3,371 | $121,000 | $22,000 | $99,000 |
| 2022 | $2,678 | $100,150 | $16,000 | $84,150 |
| 2021 | $2,288 | $82,469 | $12,000 | $70,469 |
| 2020 | $2,154 | $74,338 | $10,000 | $64,338 |
| 2019 | $2,158 | $72,797 | $10,000 | $62,797 |
| 2018 | $1,955 | $65,760 | $10,000 | $55,760 |
| 2017 | $1,966 | $65,760 | $10,000 | $55,760 |
| 2016 | $1,982 | $65,760 | $10,000 | $55,760 |
| 2015 | $1,998 | $65,760 | $10,000 | $55,760 |
| 2014 | $1,796 | $52,680 | $11,200 | $41,480 |
| 2013 | -- | $52,680 | $11,200 | $41,480 |
Source: Public Records
Map
Nearby Homes