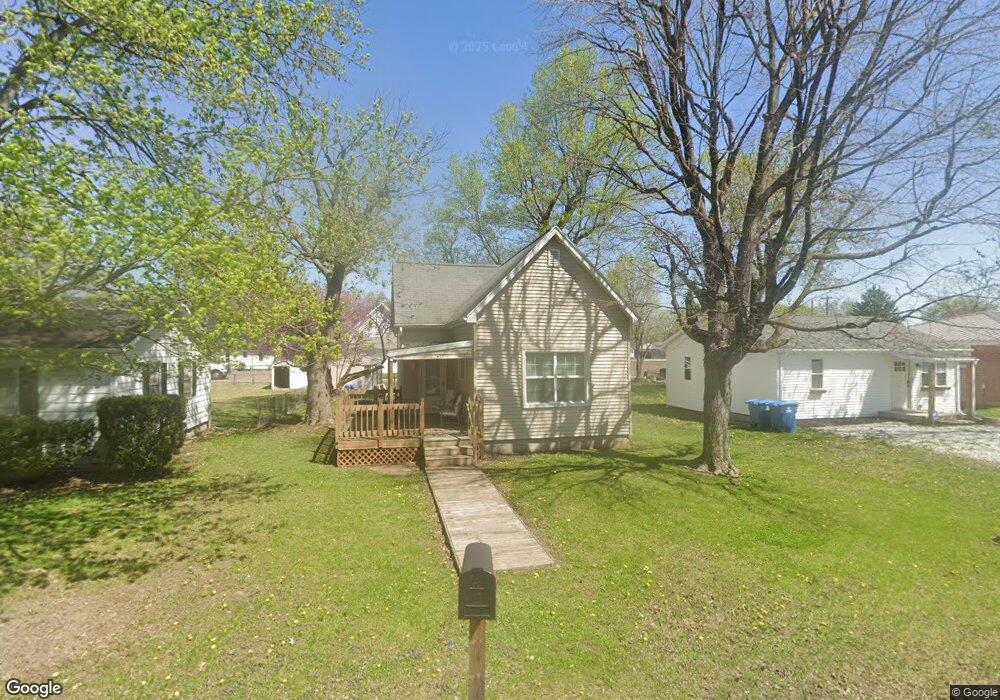
317 E South F St Gas City, IN 46933
Estimated Value: $92,000 - $116,000
3
Beds
2
Baths
888
Sq Ft
$121/Sq Ft
Est. Value
About This Home
This home is located at 317 E South F St, Gas City, IN 46933 and is currently estimated at $107,161, approximately $120 per square foot. 317 E South F St is a home located in Grant County with nearby schools including Westview Elementary School, Northview Elementary School, and R.J. Baskett Middle School.
Ownership History
Date
Name
Owned For
Owner Type
Purchase Details
Closed on
Aug 16, 2022
Sold by
Crist Sr Brian E
Bought by
Oden Brian Paul
Current Estimated Value
Home Financials for this Owner
Home Financials are based on the most recent Mortgage that was taken out on this home.
Original Mortgage
$75,000
Outstanding Balance
$68,103
Interest Rate
5.54%
Mortgage Type
New Conventional
Estimated Equity
$39,058
Purchase Details
Closed on
Jan 31, 2018
Sold by
Crist
Bought by
Brian Oden
Create a Home Valuation Report for This Property
The Home Valuation Report is an in-depth analysis detailing your home's value as well as a comparison with similar homes in the area
Home Values in the Area
Average Home Value in this Area
Purchase History
| Date | Buyer | Sale Price | Title Company |
|---|---|---|---|
| Oden Brian Paul | -- | None Listed On Document | |
| Brian Oden | $77,500 | -- |
Source: Public Records
Mortgage History
| Date | Status | Borrower | Loan Amount |
|---|---|---|---|
| Open | Oden Brian Paul | $75,000 |
Source: Public Records
Tax History Compared to Growth
Tax History
| Year | Tax Paid | Tax Assessment Tax Assessment Total Assessment is a certain percentage of the fair market value that is determined by local assessors to be the total taxable value of land and additions on the property. | Land | Improvement |
|---|---|---|---|---|
| 2024 | $566 | $87,200 | $8,500 | $78,700 |
| 2023 | $591 | $89,300 | $8,500 | $80,800 |
| 2022 | $460 | $77,600 | $7,400 | $70,200 |
| 2021 | $384 | $68,500 | $7,400 | $61,100 |
| 2020 | $363 | $68,100 | $7,400 | $60,700 |
| 2019 | $297 | $58,300 | $7,400 | $50,900 |
| 2018 | $1,170 | $58,500 | $7,400 | $51,100 |
| 2017 | $1,134 | $56,700 | $7,400 | $49,300 |
| 2016 | $1,092 | $54,600 | $7,400 | $47,200 |
| 2014 | $698 | $37,400 | $7,400 | $30,000 |
| 2013 | $698 | $34,500 | $7,400 | $27,100 |
Source: Public Records
Map
Nearby Homes
- 416 E South D St
- 416 E South C St
- 313 E South B St
- 219 E South A St
- 316 S 1st St
- 624 E South F St
- 0 E Farmington Tract 3
- 614 E South A St
- 521 E North A St
- 312 E North C St
- 120 W North A St
- 804 S 10th St
- 408 Walnut Dr
- 128 W North St E
- 117 W North F St
- 1131a E Main St
- 217 N 10th St
- 311 Douglas St
- 303 S Main St
- 517 S Main St
- 315 E South F St
- 325 E South F St
- 305 E South F St
- 312 E South F St
- 320 E South E St
- 310 E South F St
- 303 E South F St
- 306 E S "E" St
- 306 E South E St
- 320 E South F St
- 308 E South F St
- 331 E South F St
- 304 E South F St
- 324 E South F St
- 302 E South E St
- 302 E South F St
- 601 S 3rd St
- 229 E South F St
- 330 E South F St
- 315 E South E St