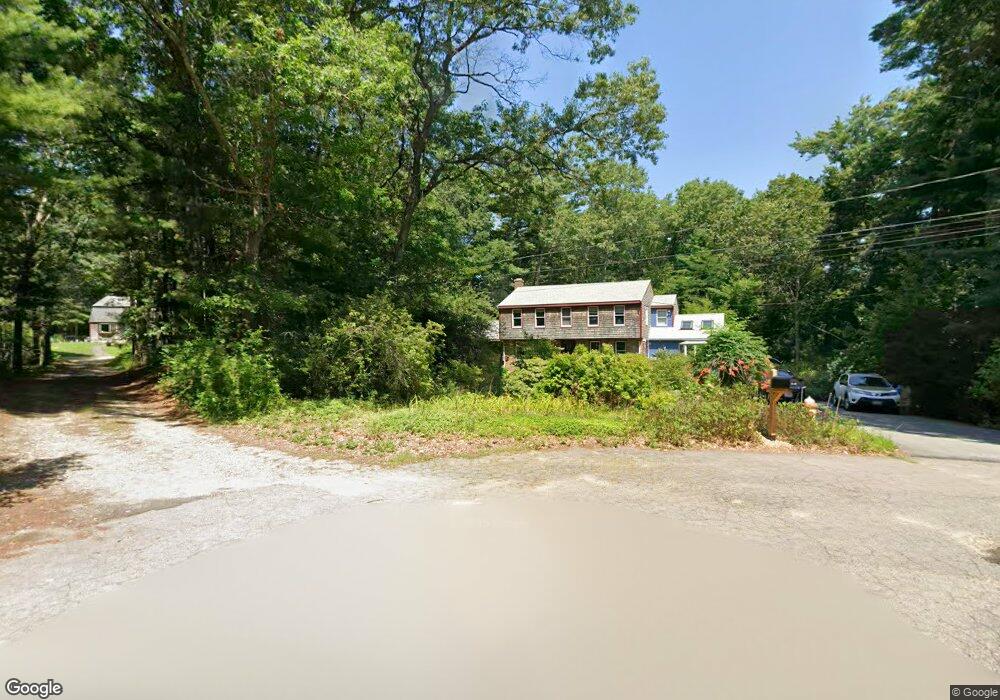
317 Ferry St Marshfield, MA 02050
Estimated Value: $879,000 - $958,000
4
Beds
4
Baths
2,392
Sq Ft
$383/Sq Ft
Est. Value
About This Home
This home is located at 317 Ferry St, Marshfield, MA 02050 and is currently estimated at $915,533, approximately $382 per square foot. 317 Ferry St is a home located in Plymouth County with nearby schools including South River, Furnace Brook Middle School, and Marshfield High School.
Ownership History
Date
Name
Owned For
Owner Type
Purchase Details
Closed on
Jun 25, 2024
Sold by
Farrugia Ft and Farrugia
Bought by
317 Ferry St Rt and Farrugia
Current Estimated Value
Purchase Details
Closed on
Sep 1, 2017
Sold by
Farrugia Louis R and Farrugia Ruth E
Bought by
Farrugia Ft and Farrugia
Create a Home Valuation Report for This Property
The Home Valuation Report is an in-depth analysis detailing your home's value as well as a comparison with similar homes in the area
Home Values in the Area
Average Home Value in this Area
Purchase History
| Date | Buyer | Sale Price | Title Company |
|---|---|---|---|
| 317 Ferry St Rt | -- | None Available | |
| 317 Ferry St Rt | -- | None Available | |
| Farrugia Ft | -- | -- | |
| Farrugia Ft | -- | -- |
Source: Public Records
Mortgage History
| Date | Status | Borrower | Loan Amount |
|---|---|---|---|
| Previous Owner | Farrugia Ft | $100,000 | |
| Previous Owner | Farrugia Ft | $190,000 |
Source: Public Records
Tax History
| Year | Tax Paid | Tax Assessment Tax Assessment Total Assessment is a certain percentage of the fair market value that is determined by local assessors to be the total taxable value of land and additions on the property. | Land | Improvement |
|---|---|---|---|---|
| 2025 | $7,760 | $783,800 | $320,200 | $463,600 |
| 2024 | $7,483 | $720,200 | $304,900 | $415,300 |
| 2023 | $6,920 | $642,500 | $283,100 | $359,400 |
| 2022 | $6,920 | $534,400 | $228,700 | $305,700 |
| 2021 | $6,610 | $501,100 | $226,500 | $274,600 |
| 2020 | $6,314 | $473,700 | $206,900 | $266,800 |
| 2019 | $6,131 | $458,200 | $206,900 | $251,300 |
| 2018 | $6,057 | $453,000 | $206,900 | $246,100 |
| 2017 | $5,790 | $422,000 | $196,000 | $226,000 |
| 2016 | $5,490 | $395,500 | $185,100 | $210,400 |
| 2015 | $5,187 | $390,300 | $185,100 | $205,200 |
| 2014 | $4,869 | $366,400 | $169,900 | $196,500 |
Source: Public Records
Map
Nearby Homes
- 14 Ferry St
- 39 High Beacon Way
- 10 Spyglass Landing Dr
- 29 Spyglass Landing Dr
- 16 Schooner Way
- 341 Furnace St
- 235 Main St
- 86 Telegraph Hill Rd
- 566 Holly Rd
- 889 Old Main Street Extension
- 290 S River St
- 1155 Main St
- 167 Planting Field Rd
- 1192 S River St
- 92 Salt Meadow Waye
- 2 Proprietors Dr Unit 25
- 2 Proprietors Dr Unit 26
- 2 Proprietors Dr Unit 27
- 60 Samuel Curtis Way
- 3 Summer St
Your Personal Tour Guide
Ask me questions while you tour the home.