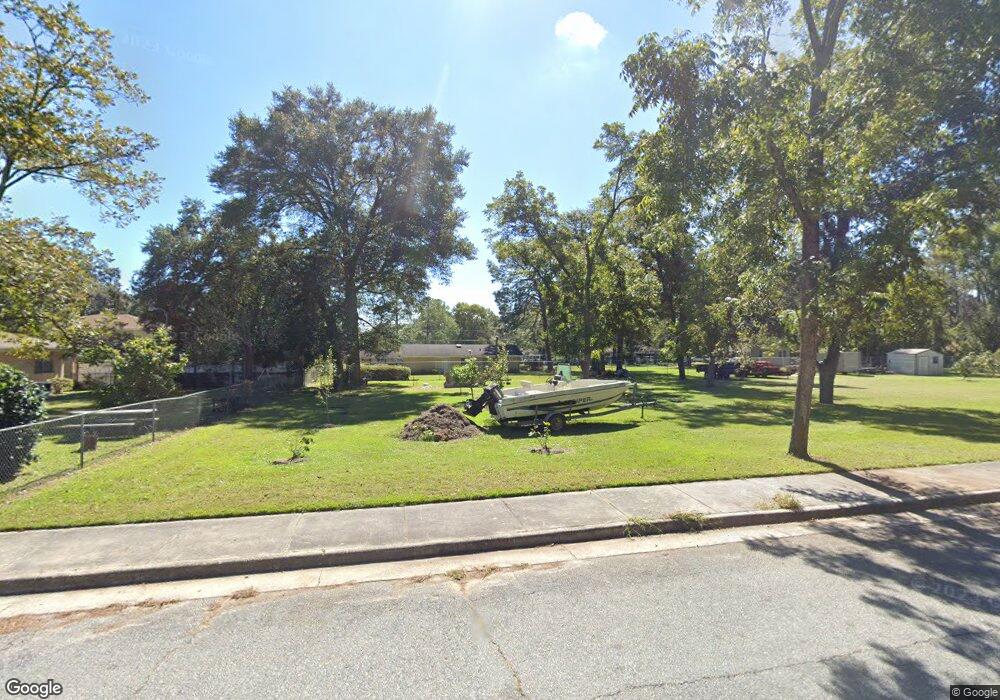
317 Forrest Waycross, GA 31501
Estimated Value: $121,000 - $189,000
3
Beds
4
Baths
1,896
Sq Ft
$79/Sq Ft
Est. Value
About This Home
This home is located at 317 Forrest, Waycross, GA 31501 and is currently estimated at $149,407, approximately $78 per square foot. 317 Forrest is a home located in Ware County with nearby schools including Williams Heights Elementary School, Waycross Middle School, and Ware County High School.
Ownership History
Date
Name
Owned For
Owner Type
Purchase Details
Closed on
Oct 4, 2017
Sold by
Andrews Jeremy L
Bought by
Collins Pamela
Current Estimated Value
Home Financials for this Owner
Home Financials are based on the most recent Mortgage that was taken out on this home.
Original Mortgage
$57,528
Interest Rate
3.78%
Mortgage Type
New Conventional
Purchase Details
Closed on
Mar 5, 2015
Sold by
Dreamwood Properties Llc
Bought by
Andrews Katelyn and Andrews Jeremy L
Home Financials for this Owner
Home Financials are based on the most recent Mortgage that was taken out on this home.
Original Mortgage
$35,500
Interest Rate
3.69%
Mortgage Type
Commercial
Purchase Details
Closed on
Oct 29, 2004
Sold by
Clark Sonya B
Bought by
Dreamwood Properties Llc
Purchase Details
Closed on
Jan 31, 2002
Sold by
Puryear John and Puryear Wendy
Bought by
Clark Sonya B
Purchase Details
Closed on
Jan 13, 1998
Sold by
Saussy Jack P
Bought by
Puryear John and Puryear Wendy
Purchase Details
Closed on
Jan 1, 1984
Create a Home Valuation Report for This Property
The Home Valuation Report is an in-depth analysis detailing your home's value as well as a comparison with similar homes in the area
Home Values in the Area
Average Home Value in this Area
Purchase History
| Date | Buyer | Sale Price | Title Company |
|---|---|---|---|
| Collins Pamela | $56,000 | -- | |
| Andrews Katelyn | $30,000 | -- | |
| Dreamwood Properties Llc | -- | -- | |
| Clark Sonya B | -- | -- | |
| Puryear John | -- | -- | |
| -- | -- | -- |
Source: Public Records
Mortgage History
| Date | Status | Borrower | Loan Amount |
|---|---|---|---|
| Closed | Collins Pamela | $57,528 | |
| Previous Owner | Andrews Katelyn | $35,500 |
Source: Public Records
Tax History Compared to Growth
Tax History
| Year | Tax Paid | Tax Assessment Tax Assessment Total Assessment is a certain percentage of the fair market value that is determined by local assessors to be the total taxable value of land and additions on the property. | Land | Improvement |
|---|---|---|---|---|
| 2024 | $1,745 | $44,020 | $2,720 | $41,300 |
| 2023 | $1,518 | $30,661 | $1,901 | $28,760 |
| 2022 | $1,222 | $30,661 | $1,901 | $28,760 |
| 2021 | $1,080 | $24,981 | $1,901 | $23,080 |
| 2020 | $946 | $21,717 | $1,901 | $19,816 |
| 2019 | $930 | $21,037 | $1,901 | $19,136 |
| 2018 | $909 | $20,357 | $1,901 | $18,456 |
| 2017 | $523 | $20,357 | $1,901 | $18,456 |
| 2016 | $523 | $20,357 | $1,901 | $18,456 |
| 2015 | $894 | $20,356 | $1,901 | $18,456 |
| 2014 | $893 | $20,357 | $1,901 | $18,456 |
| 2013 | -- | $28,624 | $1,900 | $26,723 |
Source: Public Records
Map
Nearby Homes
- 807 College St
- 1004 Hill St
- 506 Magnolia Dr
- 1101 Cherokee Dr
- 415 Dewey St
- 808 Satilla Blvd
- 502 Dewey St
- 1405 Grove Ave
- 713 Magnolia Dr
- 707 Euclid Ave
- 301 Riverside Dr
- 0 Saint Marys Dr Unit (TRACT 2 0.25 ACRES)
- .22 Alice St
- 310 Butler St
- 1500 Saint Marys Dr
- 1701 Satilla Blvd
- 903 Atlantic Ave
- 706 Cherokee Cir
- 1504 Habersham Dr
- 907 Euclid Ave
- 317 Forest Ave
- 401 Forrest Ave
- 807 Scruggs St
- 802 College St
- 802 College St Unit 2
- 400 Forest Ave
- 804 Scruggs St
- 810 College St
- 806 Scruggs St
- 403 Forrest Ave
- 400 Forrest Ave
- 805 Hill St
- 205 Forrest Ave
- 706 Scruggs St
- 807 Hill St
- 1001 Scruggs St
- 402 Forrest Ave
- 1000 Scruggs St
- 1000 College St
- 702 Scruggs St