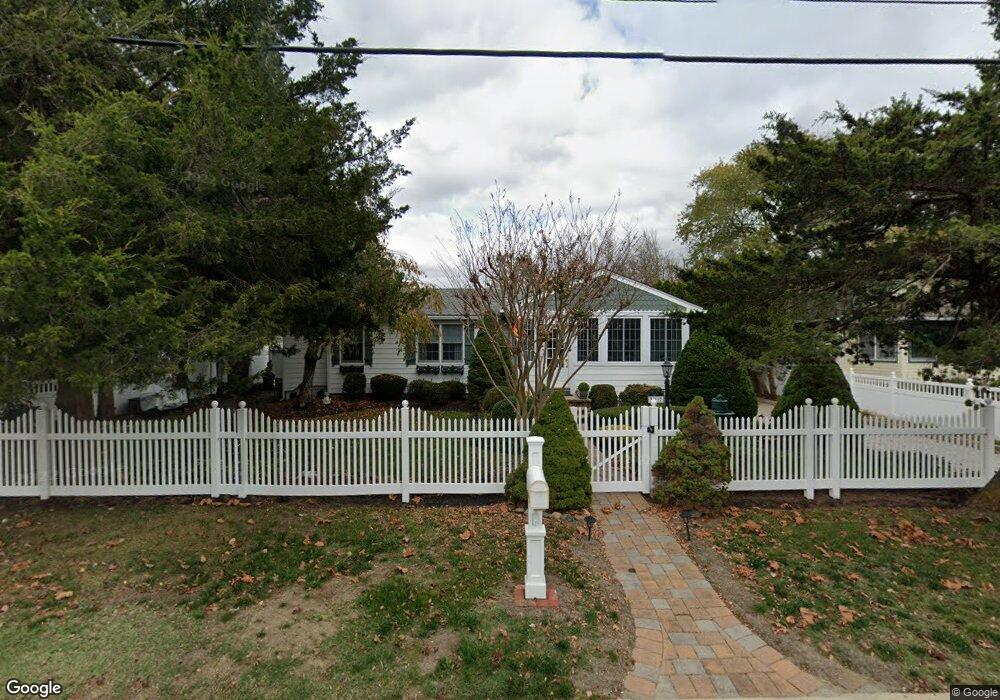
317 Fourth Ave Cape May, NJ 08204
Estimated Value: $841,036 - $1,807,000
--
Bed
--
Bath
830
Sq Ft
$1,469/Sq Ft
Est. Value
About This Home
This home is located at 317 Fourth Ave, Cape May, NJ 08204 and is currently estimated at $1,219,259, approximately $1,468 per square foot. 317 Fourth Ave is a home located in Cape May County with nearby schools including West Cape May Elementary School, Richard M. Teitelman School, and Lower Cape May Regional High School.
Ownership History
Date
Name
Owned For
Owner Type
Purchase Details
Closed on
Jul 21, 2003
Sold by
Waring Lisa M
Bought by
Healy Daniel and Healy Lisa M Waring
Current Estimated Value
Home Financials for this Owner
Home Financials are based on the most recent Mortgage that was taken out on this home.
Original Mortgage
$150,000
Outstanding Balance
$63,869
Interest Rate
5.28%
Estimated Equity
$1,155,390
Purchase Details
Closed on
Sep 9, 1995
Sold by
Dade Donald
Bought by
Waring Lisa and Waring Margaret
Create a Home Valuation Report for This Property
The Home Valuation Report is an in-depth analysis detailing your home's value as well as a comparison with similar homes in the area
Home Values in the Area
Average Home Value in this Area
Purchase History
| Date | Buyer | Sale Price | Title Company |
|---|---|---|---|
| Healy Daniel | -- | -- | |
| Waring Lisa | $35,000 | -- |
Source: Public Records
Mortgage History
| Date | Status | Borrower | Loan Amount |
|---|---|---|---|
| Open | Healy Daniel | $150,000 |
Source: Public Records
Tax History Compared to Growth
Tax History
| Year | Tax Paid | Tax Assessment Tax Assessment Total Assessment is a certain percentage of the fair market value that is determined by local assessors to be the total taxable value of land and additions on the property. | Land | Improvement |
|---|---|---|---|---|
| 2025 | $4,861 | $323,200 | $260,000 | $63,200 |
| 2024 | $4,861 | $323,200 | $260,000 | $63,200 |
| 2023 | $4,916 | $323,200 | $260,000 | $63,200 |
| 2022 | $4,379 | $323,200 | $260,000 | $63,200 |
| 2021 | $4,137 | $323,200 | $260,000 | $63,200 |
| 2020 | $4,263 | $323,200 | $260,000 | $63,200 |
| 2019 | $4,053 | $323,200 | $260,000 | $63,200 |
| 2018 | $4,088 | $323,200 | $260,000 | $63,200 |
| 2017 | $3,950 | $323,200 | $260,000 | $63,200 |
| 2016 | $3,950 | $323,200 | $260,000 | $63,200 |
| 2015 | $3,714 | $323,200 | $260,000 | $63,200 |
| 2014 | $3,714 | $323,200 | $260,000 | $63,200 |
Source: Public Records
Map
Nearby Homes