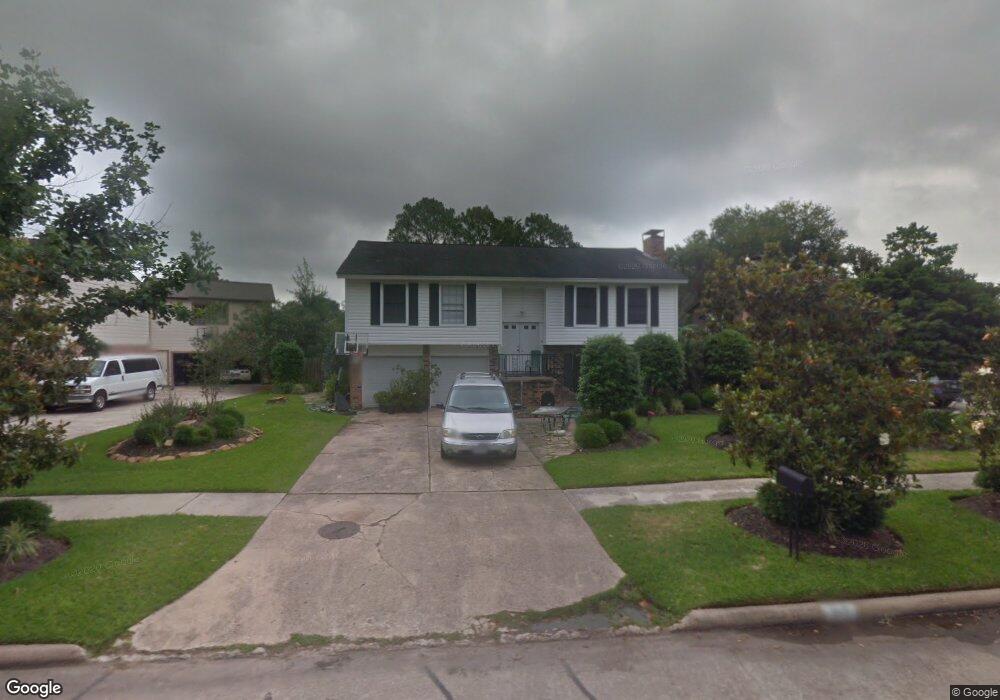
317 Gleneagles Dr Friendswood, TX 77546
Estimated Value: $272,000 - $336,000
4
Beds
2
Baths
2,089
Sq Ft
$145/Sq Ft
Est. Value
About This Home
This home is located at 317 Gleneagles Dr, Friendswood, TX 77546 and is currently estimated at $303,246, approximately $145 per square foot. 317 Gleneagles Dr is a home located in Galveston County with nearby schools including C.W. Cline Elementary School, Windsong Elementary School, and Friendswood Junior High School.
Ownership History
Date
Name
Owned For
Owner Type
Purchase Details
Closed on
May 20, 2004
Sold by
Maleche Vincent
Bought by
Burke Rae L and Burke Jeffrey W
Current Estimated Value
Home Financials for this Owner
Home Financials are based on the most recent Mortgage that was taken out on this home.
Original Mortgage
$115,000
Interest Rate
6.02%
Mortgage Type
Seller Take Back
Purchase Details
Closed on
Nov 4, 2003
Sold by
Mortgage Electronic Registration Systems
Bought by
Hud
Purchase Details
Closed on
Nov 16, 2001
Sold by
Wright Richard K
Bought by
Obrien Michael P and Obrien Kim S
Home Financials for this Owner
Home Financials are based on the most recent Mortgage that was taken out on this home.
Original Mortgage
$123,616
Interest Rate
6.54%
Mortgage Type
FHA
Create a Home Valuation Report for This Property
The Home Valuation Report is an in-depth analysis detailing your home's value as well as a comparison with similar homes in the area
Home Values in the Area
Average Home Value in this Area
Purchase History
| Date | Buyer | Sale Price | Title Company |
|---|---|---|---|
| Burke Rae L | -- | -- | |
| Maleche Vincent | -- | Fidelity National Title | |
| Hud | -- | -- | |
| Mortgage Electronic Registration Systems | $134,997 | -- | |
| Obrien Michael P | -- | Chicago Title |
Source: Public Records
Mortgage History
| Date | Status | Borrower | Loan Amount |
|---|---|---|---|
| Closed | Burke Rae L | $115,000 | |
| Previous Owner | Obrien Michael P | $123,616 |
Source: Public Records
Tax History Compared to Growth
Tax History
| Year | Tax Paid | Tax Assessment Tax Assessment Total Assessment is a certain percentage of the fair market value that is determined by local assessors to be the total taxable value of land and additions on the property. | Land | Improvement |
|---|---|---|---|---|
| 2025 | $3,406 | $301,940 | $47,490 | $254,450 |
| 2024 | $3,406 | $299,941 | -- | -- |
| 2023 | $3,406 | $272,674 | $0 | $0 |
| 2022 | $5,460 | $247,885 | $0 | $0 |
| 2021 | $5,264 | $266,940 | $47,490 | $219,450 |
| 2020 | $4,936 | $223,620 | $47,490 | $176,130 |
| 2019 | $4,729 | $186,240 | $26,220 | $160,020 |
| 2018 | $4,759 | $188,290 | $26,220 | $162,070 |
| 2017 | $4,399 | $190,300 | $26,220 | $164,080 |
| 2016 | $3,999 | $169,090 | $26,220 | $142,870 |
| 2015 | $1,272 | $155,180 | $26,220 | $128,960 |
| 2014 | $1,197 | $127,260 | $26,220 | $101,040 |
Source: Public Records
Map
Nearby Homes
- 2512 Ravenna Ct
- 40 Windsong Ln
- 601 E Castle Harbour Dr
- 644 E Castle Harbour Dr
- 110 Dorado Dr
- 251 Saint Cloud Dr
- 2605 S Mission Cir
- 2211 S Mission Cir
- Amalfi Plan at Friendswood Trails
- Portofino Plan at Friendswood Trails
- Postiano Plan at Friendswood Trails
- Capri Plan at Friendswood Trails
- Ravello Plan at Friendswood Trails
- 1910 N Mission Cir
- 1508 Harvest Vine Ct
- 2829 Fairway Dr
- 2904 Bridle Path Ln
- 2117 San Miguel Dr
- 2082 Wilderness Trail
- 1804 Anna Way
- 321 Gleneagles Dr
- 312 Old Course Dr
- 325 Gleneagles Dr
- 316 Old Course Dr
- 309 Gleneagles Dr
- 308 Old Course Dr
- 202 Pecan Valley Ct
- 320 Old Course Dr
- 318 Gleneagles Dr
- 322 Gleneagles Dr
- 329 Gleneagles Dr
- 305 Gleneagles Dr
- 304 Old Course Dr
- 324 Old Course Dr
- 206 Pecan Valley Ct
- 326 Gleneagles Dr
- 203 Pecan Valley Ct
- 333 Gleneagles Dr
- 301 Gleneagles Dr
- 300 Old Course Dr