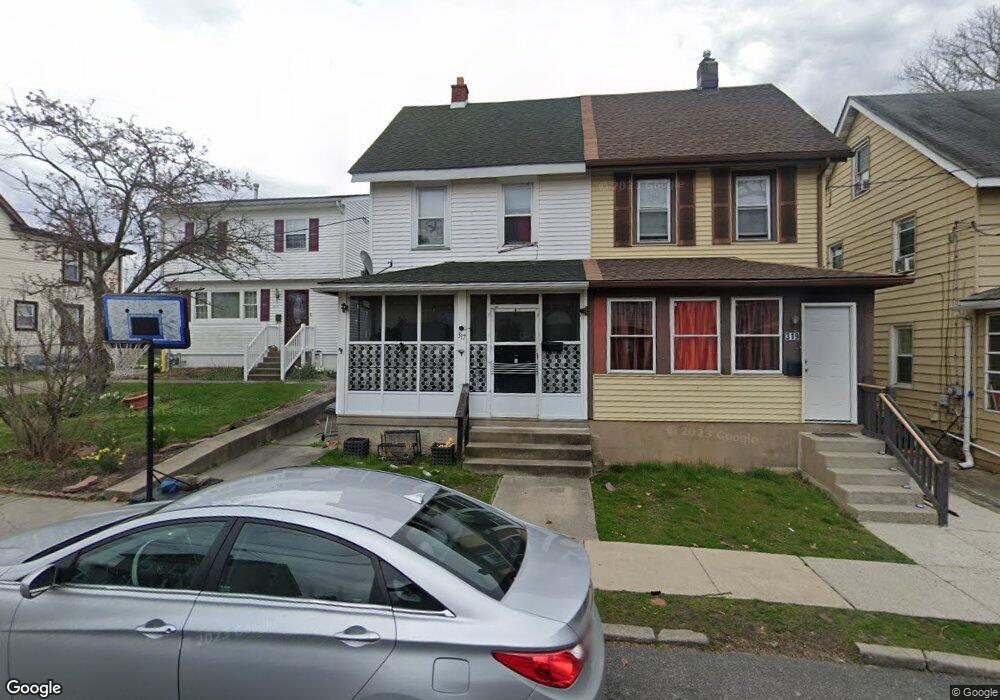
317 High St Westville, NJ 08093
Estimated Value: $180,000 - $234,000
3
Beds
2
Baths
1,184
Sq Ft
$183/Sq Ft
Est. Value
About This Home
This home is located at 317 High St, Westville, NJ 08093 and is currently estimated at $217,020, approximately $183 per square foot. 317 High St is a home located in Gloucester County with nearby schools including Parkview Elementary School, Gateway Regional High School, and Gloucester Catholic Junior Senior High School.
Ownership History
Date
Name
Owned For
Owner Type
Purchase Details
Closed on
Sep 18, 2019
Sold by
Shah Adil
Bought by
Kalam Alyaz
Current Estimated Value
Purchase Details
Closed on
Jan 20, 2016
Sold by
Fulton Bank Of New Jersey
Bought by
Shah Adil
Purchase Details
Closed on
Jul 16, 2014
Sold by
Delaney John A and Delaney Mrs John A
Bought by
Fulton Bank Of New Jersey
Purchase Details
Closed on
May 2, 1997
Sold by
Cranmer Clarence W and Cranmer Clarence W
Bought by
Delaney John A
Home Financials for this Owner
Home Financials are based on the most recent Mortgage that was taken out on this home.
Original Mortgage
$47,650
Interest Rate
7.85%
Create a Home Valuation Report for This Property
The Home Valuation Report is an in-depth analysis detailing your home's value as well as a comparison with similar homes in the area
Home Values in the Area
Average Home Value in this Area
Purchase History
| Date | Buyer | Sale Price | Title Company |
|---|---|---|---|
| Kalam Alyaz | -- | None Available | |
| Shah Adil | $39,900 | None Available | |
| Fulton Bank Of New Jersey | -- | Attorney | |
| Delaney John A | $50,200 | -- |
Source: Public Records
Mortgage History
| Date | Status | Borrower | Loan Amount |
|---|---|---|---|
| Previous Owner | Delaney John A | $47,650 |
Source: Public Records
Tax History Compared to Growth
Tax History
| Year | Tax Paid | Tax Assessment Tax Assessment Total Assessment is a certain percentage of the fair market value that is determined by local assessors to be the total taxable value of land and additions on the property. | Land | Improvement |
|---|---|---|---|---|
| 2025 | $4,086 | $75,100 | $20,300 | $54,800 |
| 2024 | $3,956 | $75,100 | $20,300 | $54,800 |
| 2023 | $3,956 | $75,100 | $20,300 | $54,800 |
| 2022 | $3,842 | $75,100 | $20,300 | $54,800 |
| 2021 | $2,868 | $75,100 | $20,300 | $54,800 |
| 2020 | $3,659 | $75,100 | $20,300 | $54,800 |
| 2019 | $3,563 | $75,100 | $20,300 | $54,800 |
| 2018 | $3,409 | $75,100 | $20,300 | $54,800 |
| 2017 | $3,501 | $75,100 | $20,300 | $54,800 |
| 2016 | $3,386 | $75,100 | $20,300 | $54,800 |
| 2015 | $3,234 | $75,100 | $20,300 | $54,800 |
| 2014 | $3,270 | $88,000 | $31,500 | $56,500 |
Source: Public Records
Map
Nearby Homes