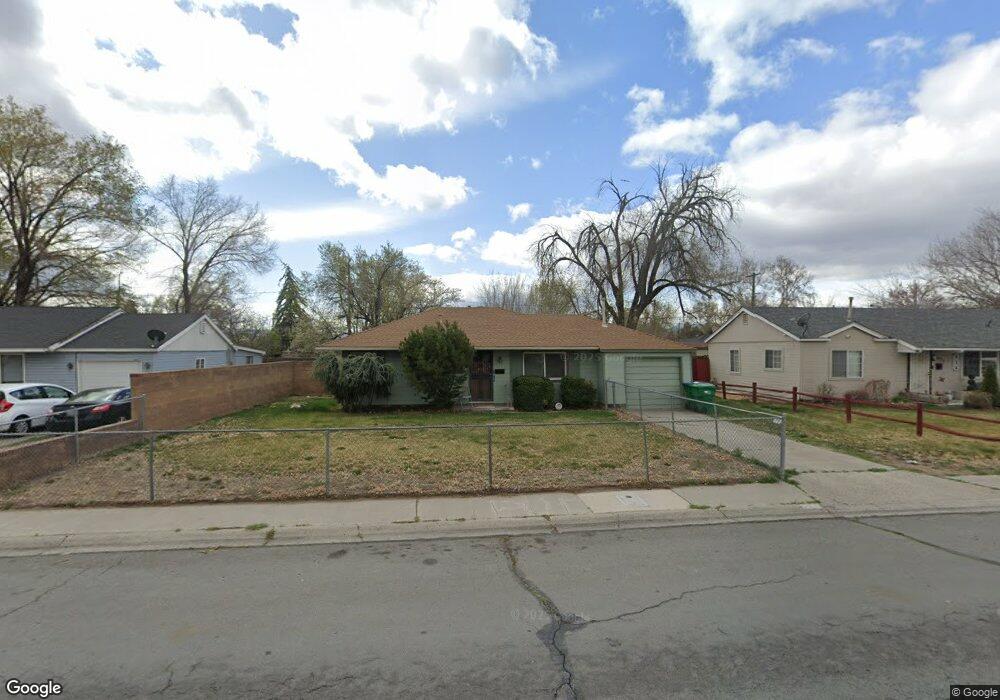
317 I St Sparks, NV 89431
Downtown Sparks NeighborhoodEstimated Value: $335,000 - $357,000
2
Beds
1
Bath
875
Sq Ft
$395/Sq Ft
Est. Value
About This Home
This home is located at 317 I St, Sparks, NV 89431 and is currently estimated at $345,501, approximately $394 per square foot. 317 I St is a home located in Washoe County with nearby schools including Greenbrae Elementary School, George L Dilworth Middle School, and Sparks High School.
Ownership History
Date
Name
Owned For
Owner Type
Purchase Details
Closed on
Jun 10, 2004
Sold by
Scott Vicki and Scott William L
Bought by
Manatt Charlene A
Current Estimated Value
Home Financials for this Owner
Home Financials are based on the most recent Mortgage that was taken out on this home.
Original Mortgage
$123,200
Outstanding Balance
$55,352
Interest Rate
5.12%
Mortgage Type
Unknown
Estimated Equity
$290,149
Purchase Details
Closed on
May 15, 1996
Sold by
Peterson James D
Bought by
Peterson Vicki
Create a Home Valuation Report for This Property
The Home Valuation Report is an in-depth analysis detailing your home's value as well as a comparison with similar homes in the area
Home Values in the Area
Average Home Value in this Area
Purchase History
| Date | Buyer | Sale Price | Title Company |
|---|---|---|---|
| Manatt Charlene A | $174,000 | Western Title Incorporated | |
| Peterson Vicki | -- | -- |
Source: Public Records
Mortgage History
| Date | Status | Borrower | Loan Amount |
|---|---|---|---|
| Open | Manatt Charlene A | $123,200 | |
| Closed | Manatt Charlene A | $15,400 |
Source: Public Records
Tax History Compared to Growth
Tax History
| Year | Tax Paid | Tax Assessment Tax Assessment Total Assessment is a certain percentage of the fair market value that is determined by local assessors to be the total taxable value of land and additions on the property. | Land | Improvement |
|---|---|---|---|---|
| 2026 | $449 | $47,446 | $34,090 | $13,356 |
| 2024 | $586 | $43,158 | $30,065 | $13,094 |
| 2023 | $573 | $43,428 | $31,325 | $12,103 |
| 2022 | $557 | $36,053 | $26,180 | $9,873 |
| 2021 | $540 | $27,570 | $17,955 | $9,615 |
| 2020 | $521 | $26,380 | $16,940 | $9,440 |
| 2019 | $505 | $24,809 | $15,890 | $8,919 |
| 2018 | $493 | $20,275 | $11,725 | $8,550 |
| 2017 | $477 | $18,790 | $10,395 | $8,395 |
| 2016 | $465 | $17,733 | $9,345 | $8,388 |
| 2015 | $120 | $16,044 | $7,700 | $8,344 |
| 2014 | $455 | $14,334 | $6,440 | $7,894 |
| 2013 | -- | $11,972 | $4,270 | $7,702 |
Source: Public Records
Map
Nearby Homes
- 97 Prater Way
- 109 M St
- 10 Lincoln Way
- 115 P St
- 8 E O St
- 1945 4th St Unit 32
- 1945 4th St Unit 33
- 1945 4th St Unit 51
- 1940 4th St Unit 51
- 402 5th St
- 2021 1st St
- 343 Richards Way
- 370 O'Brien Way
- 1016 Prater Way
- 360 E Lincoln Way
- 1003 Sbragia Way
- 1010 12th St
- 445 Pine Meadows Dr Unit E25
- 560 Nichols Blvd
- 1025 Tyler Way