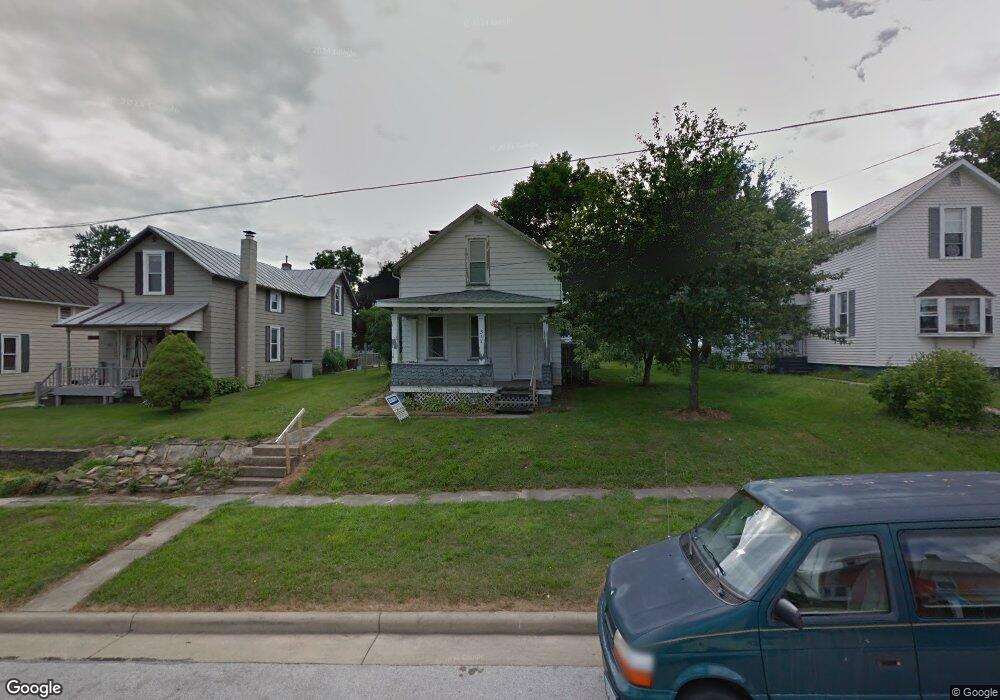
317 James St Bucyrus, OH 44820
Estimated Value: $75,000 - $135,000
2
Beds
1
Bath
1,360
Sq Ft
$83/Sq Ft
Est. Value
About This Home
This home is located at 317 James St, Bucyrus, OH 44820 and is currently estimated at $112,518, approximately $82 per square foot. 317 James St is a home located in Crawford County with nearby schools including Bucyrus Elementary School, Bucyrus Secondary School, and Holy Trinity School.
Ownership History
Date
Name
Owned For
Owner Type
Purchase Details
Closed on
Nov 12, 2018
Sold by
Bair Chad A and Bair Emily S
Bought by
Park Vicki L
Current Estimated Value
Home Financials for this Owner
Home Financials are based on the most recent Mortgage that was taken out on this home.
Original Mortgage
$52,380
Outstanding Balance
$45,408
Interest Rate
4.7%
Mortgage Type
New Conventional
Estimated Equity
$67,110
Purchase Details
Closed on
Mar 14, 2015
Sold by
B Ltd
Bought by
Bair Chad A and Bair Emily S
Home Financials for this Owner
Home Financials are based on the most recent Mortgage that was taken out on this home.
Original Mortgage
$36,800
Interest Rate
3.67%
Mortgage Type
New Conventional
Purchase Details
Closed on
Jul 11, 2014
Sold by
Nationstar Mortgage Llc
Bought by
Three B Ltd
Purchase Details
Closed on
Jun 13, 2014
Sold by
Crokie Jerry E and Crokie Tami L
Bought by
Nationstar Mortgage Llc
Create a Home Valuation Report for This Property
The Home Valuation Report is an in-depth analysis detailing your home's value as well as a comparison with similar homes in the area
Home Values in the Area
Average Home Value in this Area
Purchase History
| Date | Buyer | Sale Price | Title Company |
|---|---|---|---|
| Park Vicki L | $54,000 | Acs Title Bucyrus | |
| Bair Chad A | $46,000 | Attorney | |
| Three B Ltd | $10,000 | None Available | |
| Nationstar Mortgage Llc | $82,485 | None Available |
Source: Public Records
Mortgage History
| Date | Status | Borrower | Loan Amount |
|---|---|---|---|
| Open | Park Vicki L | $52,380 | |
| Previous Owner | Bair Chad A | $36,800 |
Source: Public Records
Tax History
| Year | Tax Paid | Tax Assessment Tax Assessment Total Assessment is a certain percentage of the fair market value that is determined by local assessors to be the total taxable value of land and additions on the property. | Land | Improvement |
|---|---|---|---|---|
| 2025 | $1,112 | $24,980 | $4,850 | $20,130 |
| 2024 | $1,112 | $24,980 | $4,850 | $20,130 |
| 2023 | $1,127 | $16,510 | $4,850 | $11,660 |
| 2022 | $881 | $16,510 | $4,850 | $11,660 |
| 2021 | $879 | $16,510 | $4,850 | $11,660 |
| 2020 | $842 | $14,990 | $4,850 | $10,140 |
| 2019 | $861 | $14,990 | $4,850 | $10,140 |
| 2018 | $857 | $14,990 | $4,850 | $10,140 |
| 2017 | $787 | $13,290 | $4,850 | $8,440 |
| 2016 | $763 | $13,290 | $4,850 | $8,440 |
| 2015 | $752 | $13,290 | $4,850 | $8,440 |
| 2014 | -- | $13,290 | $4,850 | $8,440 |
| 2013 | -- | $13,290 | $4,850 | $8,440 |
Source: Public Records
Map
Nearby Homes
- 414 River St
- 725 W Perry St
- 400 W Mansfield St
- 885 W Perry St
- 611 W Warren St
- 740 Gay St
- 223 E Rensselaer St
- 231 E Rensselaer St
- 325 W Liberty St
- 549 S Poplar St
- 809 Wingert St
- 317 E Rensselaer St
- 407 E Mansfield St
- 412 E Rensselaer St
- 320 S Lane St
- 550 S Sandusky Ave
- 118 E Liberty St
- 1023
- 550 S Walnut St
- 1023 Tiffin St Unit Lot 5
Your Personal Tour Guide
Ask me questions while you tour the home.