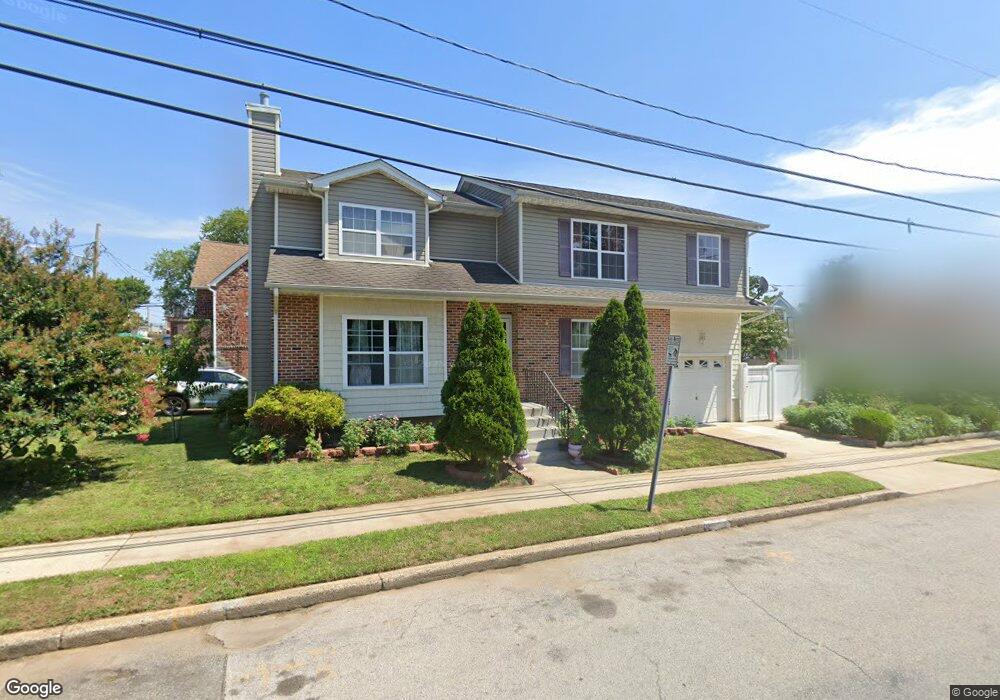
317 Keller Ave Elmont, NY 11003
Estimated Value: $853,025 - $896,000
5
Beds
4
Baths
1,883
Sq Ft
$464/Sq Ft
Est. Value
About This Home
This home is located at 317 Keller Ave, Elmont, NY 11003 and is currently estimated at $874,513, approximately $464 per square foot. 317 Keller Ave is a home located in Nassau County with nearby schools including Cheder at the Ohel.
Ownership History
Date
Name
Owned For
Owner Type
Purchase Details
Closed on
May 11, 2020
Sold by
Basnet Sudhir and Singh Roshan
Bought by
Basnet Sudhir
Current Estimated Value
Home Financials for this Owner
Home Financials are based on the most recent Mortgage that was taken out on this home.
Original Mortgage
$13,974
Outstanding Balance
$12,356
Interest Rate
3.3%
Mortgage Type
New Conventional
Estimated Equity
$862,157
Purchase Details
Closed on
Dec 18, 2017
Sold by
Mizelle Mary
Bought by
Basnet Sudhir and Singh Roshan
Home Financials for this Owner
Home Financials are based on the most recent Mortgage that was taken out on this home.
Original Mortgage
$440,000
Outstanding Balance
$369,669
Interest Rate
3.95%
Mortgage Type
New Conventional
Estimated Equity
$504,844
Purchase Details
Closed on
May 13, 2004
Sold by
Ada Development Corp
Bought by
Mizelle Mary
Create a Home Valuation Report for This Property
The Home Valuation Report is an in-depth analysis detailing your home's value as well as a comparison with similar homes in the area
Home Values in the Area
Average Home Value in this Area
Purchase History
| Date | Buyer | Sale Price | Title Company |
|---|---|---|---|
| Basnet Sudhir | -- | Judicial Title | |
| Basnet Sudhir | -- | Judicial Title | |
| Basnet Sudhir | -- | Judicial Title | |
| Basnet Sudhir | $550,000 | Old Republic Title | |
| Basnet Sudhir | $550,000 | Old Republic Title | |
| Basnet Sudhir | $550,000 | Old Republic Title | |
| Mizelle Mary | $470,000 | -- | |
| Mizelle Mary | $470,000 | -- |
Source: Public Records
Mortgage History
| Date | Status | Borrower | Loan Amount |
|---|---|---|---|
| Open | Basnet Sudhir | $13,974 | |
| Closed | Basnet Sudhir | $13,974 | |
| Open | Basnet Sudhir | $440,000 | |
| Closed | Basnet Sudhir | $440,000 |
Source: Public Records
Tax History Compared to Growth
Tax History
| Year | Tax Paid | Tax Assessment Tax Assessment Total Assessment is a certain percentage of the fair market value that is determined by local assessors to be the total taxable value of land and additions on the property. | Land | Improvement |
|---|---|---|---|---|
| 2025 | $13,705 | $546 | $186 | $360 |
| 2024 | $4,449 | $575 | $196 | $379 |
| 2023 | $12,666 | $575 | $202 | $373 |
| 2022 | $12,666 | $557 | $196 | $361 |
| 2021 | $14,938 | $575 | $190 | $385 |
| 2020 | $11,256 | $724 | $367 | $357 |
| 2019 | $3,903 | $724 | $367 | $357 |
| 2018 | $7,559 | $724 | $0 | $0 |
| 2017 | $5,746 | $724 | $367 | $357 |
| 2016 | $9,298 | $724 | $367 | $357 |
| 2015 | $3,300 | $724 | $367 | $357 |
| 2014 | $3,300 | $724 | $367 | $357 |
| 2013 | $3,093 | $724 | $367 | $357 |
Source: Public Records
Map
Nearby Homes
- 289 Keller Ave
- 389 Kirkman Ave
- 247 Oakley Ave
- 1471 Rosser Ave
- 431 Kirkman Ave
- 1361 Star Ave
- 1316 News Ave
- 345 Evans Ave
- 335 Evans Ave
- 1332 A St
- 376 Hunnewell Ave
- 291 Evans Ave
- 311 Travis Ave
- 389 Hunnewell Ave
- 1280 Arlington Ave
- 1314 Globe Ave
- 296 Benson Ave
- 206 Hunnewell Ave
- 489 Eureka Ave
- 342 Lucille Ave
- 1389 Kiefer Ave
- 327 Keller Ave
- 1379 Kiefer Ave
- 1391 Kiefer Ave
- 331 Keller Ave
- 1390 Kiefer Ave
- 328 Keller Ave
- 318 Oakley Ave
- 335 Keller Ave
- 1380 Kiefer Ave
- 1399 Kiefer Ave
- 312 Oakley Ave
- 1392 Kiefer Ave
- 332 Oakley Ave
- 332 Keller Ave
- 341 Keller Ave
- 1403 Kiefer Ave
- 336 Oakley Ave
- 0 Oakley Ave
- 1400 Kiefer Ave