317 Main St Fillmore, CA 93015
Estimated Value: $670,000 - $838,000
About This Home
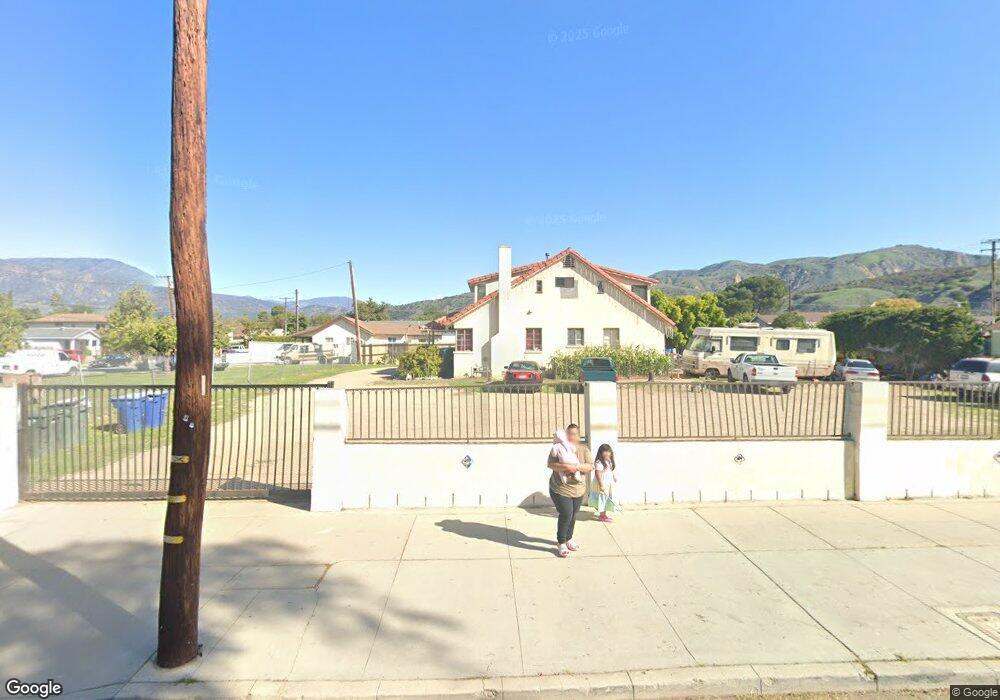
This home is located at 317 Main St, Fillmore, CA 93015 and is currently estimated at $785,343, approximately $407 per square foot. 317 Main St is a home located in Ventura County with nearby schools including San Cayetano Elementary School and Fillmore Senior High.
Ownership History
We collect this data history from publicly available records. To have your information removed, we recommend requesting removal directly through your county’s website.
Purchase Details
Home Financials for this Owner
Home Financials are based on the most recent Mortgage that was taken out on this home.Home Values in the Area
Average Home Value in this Area
Purchase History
We collect this data history from publicly available records. To have your information removed, we recommend requesting removal directly through your county’s website.
| Date | Buyer | Sale Price | Title Company |
|---|---|---|---|
| $240,000 | Chicago Title Co |
Mortgage History
We collect this data history from publicly available records. To have your information removed, we recommend requesting removal directly through your county’s website.
| Date | Status | Borrower | Loan Amount |
|---|---|---|---|
| Open | $192,000 |
Tax History
We collect this data history from publicly available records. To have your information removed, we recommend requesting removal directly through your county’s website.
| Year | Tax Paid | Tax Assessment Tax Assessment Total Assessment is a certain percentage of the fair market value that is determined by local assessors to be the total taxable value of land and additions on the property. | Land | Improvement |
|---|---|---|---|---|
| 2025 | $4,728 | $432,773 | $276,768 | $156,005 |
| 2024 | $4,728 | $424,288 | $271,341 | $152,947 |
| 2023 | $4,663 | $415,969 | $266,020 | $149,949 |
| 2022 | $4,309 | $407,813 | $260,804 | $147,009 |
| 2021 | $4,900 | $399,817 | $255,690 | $144,127 |
| 2020 | $4,544 | $395,719 | $253,069 | $142,650 |
| 2019 | $4,556 | $387,960 | $248,107 | $139,853 |
| 2018 | $4,463 | $380,354 | $243,243 | $137,111 |
| 2017 | $4,488 | $372,897 | $238,474 | $134,423 |
| 2016 | $4,153 | $365,587 | $233,799 | $131,788 |
| 2015 | $4,037 | $360,097 | $230,288 | $129,809 |
| 2014 | $3,356 | $294,000 | $189,000 | $105,000 |
Map
- 328 Clay St
- 449 Clay St
- 340 Central Ave
- 300 Fillmore St
- 404 Central Ave
- 207 Clearwood St
- 232 River St
- 639 Mountain View St
- 639 Clay St
- 512 Mulberry Ln
- 333 3rd St
- 646 River St Unit D
- 331 Blaine Ave
- 44 Clearwood St
- 250 E Telegraph Rd Unit 307
- 250 E Telegraph Rd Unit 68
- 250 E Telegraph Rd Unit SPC 104
- 250 E Telegraph Rd Unit 1
- 250 E Telegraph Rd Unit 213
- 250 E Telegraph Rd Unit 155
- 311 Main St
- 332 Clay St
- 307 Main St
- 334 Clay St
- 334 Clay St
- 329 Mountain View St
- 305 Main St
- 333 Mountain View St
- 336 Clay St
- 335 Mountain View St
- 301 Main St
- 309 Heritage
- 338 Clay St
- 339 Mountain View St
- 346 Clay St
- 343 Mountain View St
- 333 Clay St
- 318 Mountain View St Unit 326
- 335 Clay St
- 347 Mountain View St
Ask me questions while you tour the home.