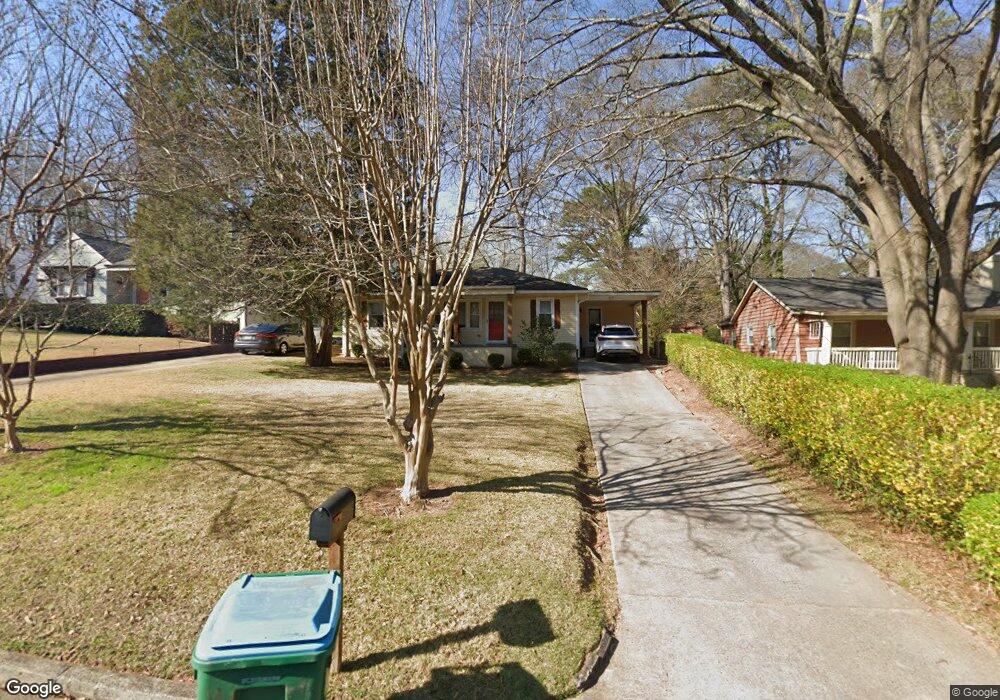
317 Maple St Atlanta, GA 30354
Estimated Value: $270,115 - $356,000
3
Beds
2
Baths
1,350
Sq Ft
$218/Sq Ft
Est. Value
About This Home
This home is located at 317 Maple St, Atlanta, GA 30354 and is currently estimated at $294,529, approximately $218 per square foot. 317 Maple St is a home located in Fulton County with nearby schools including Hapeville Elementary School, Paul D. West Middle School, and Tri-Cities High School.
Ownership History
Date
Name
Owned For
Owner Type
Purchase Details
Closed on
Nov 2, 2018
Sold by
Maldonado Sandra
Bought by
Guidry Neichelle R
Current Estimated Value
Home Financials for this Owner
Home Financials are based on the most recent Mortgage that was taken out on this home.
Original Mortgage
$191,920
Outstanding Balance
$167,022
Interest Rate
4.7%
Mortgage Type
New Conventional
Estimated Equity
$127,507
Purchase Details
Closed on
May 10, 2018
Sold by
Adams Andrea Gail Pate Est
Bought by
Maldonado William and Maldonado Sandra
Create a Home Valuation Report for This Property
The Home Valuation Report is an in-depth analysis detailing your home's value as well as a comparison with similar homes in the area
Home Values in the Area
Average Home Value in this Area
Purchase History
| Date | Buyer | Sale Price | Title Company |
|---|---|---|---|
| Guidry Neichelle R | $239,900 | -- | |
| Maldonado William | $100,000 | -- |
Source: Public Records
Mortgage History
| Date | Status | Borrower | Loan Amount |
|---|---|---|---|
| Open | Guidry Neichelle R | $191,920 |
Source: Public Records
Tax History
| Year | Tax Paid | Tax Assessment Tax Assessment Total Assessment is a certain percentage of the fair market value that is determined by local assessors to be the total taxable value of land and additions on the property. | Land | Improvement |
|---|---|---|---|---|
| 2025 | $1,919 | $112,960 | $21,920 | $91,040 |
| 2023 | $3,094 | $109,600 | $26,800 | $82,800 |
| 2022 | $2,436 | $92,600 | $34,200 | $58,400 |
| 2021 | $2,980 | $69,520 | $22,520 | $47,000 |
| 2020 | $1,846 | $42,160 | $19,120 | $23,040 |
| 2019 | $1,187 | $73,680 | $7,560 | $66,120 |
| 2018 | $677 | $36,680 | $7,400 | $29,280 |
| 2017 | $261 | $15,880 | $5,480 | $10,400 |
| 2016 | $261 | $15,880 | $5,480 | $10,400 |
| 2015 | $359 | $15,880 | $5,480 | $10,400 |
| 2014 | $262 | $15,880 | $5,480 | $10,400 |
Source: Public Records
Map
Nearby Homes
- 3143 Old Jonesboro Rd
- 254 Maple St
- 330 Mount Zion Rd
- 269 Moreland Way
- 3098 Jackson St
- 437 Oak Dr
- 3010 1st Ave SW
- 455 Moreland Way
- 3024 Grand Ave SW
- 220 Mount Zion Rd
- 3189 Jackson St
- 3189 Jackson St Unit A
- 356 Lake Dr
- 0 5th St SW
- 947 Willingham Dr Unit 2
- 511 Walnut St
- 447 Walnut St
- 3165 Dogwood Dr Unit 106
- 535 Walnut St
- 2860 3rd Ave SW
Your Personal Tour Guide
Ask me questions while you tour the home.