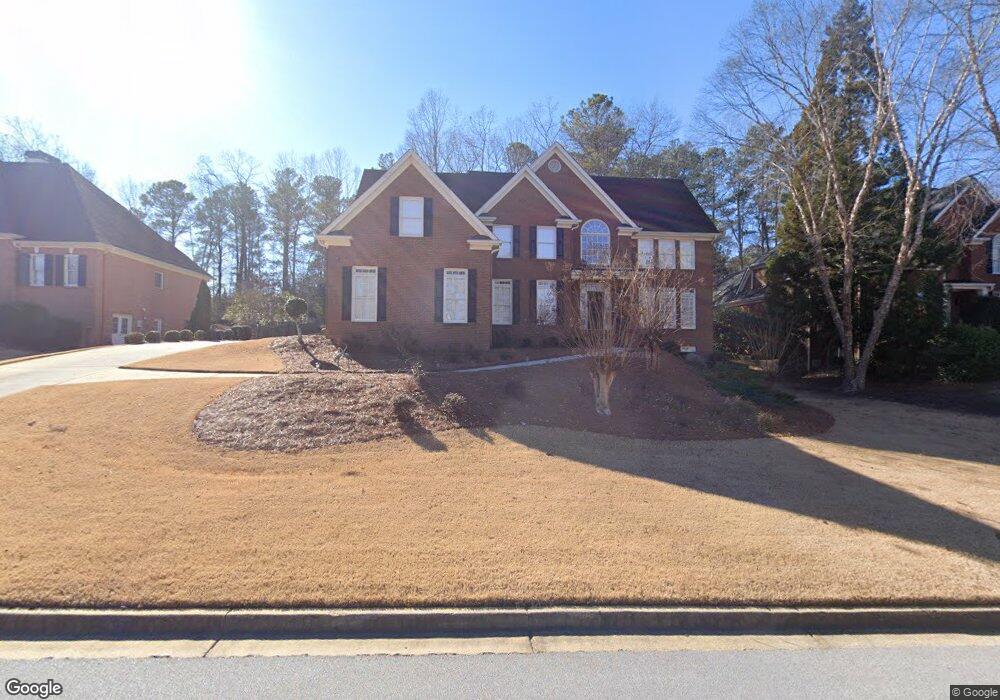
317 Morning Glory Trail Unit V Powder Springs, GA 30127
West Cobb NeighborhoodEstimated Value: $681,000 - $790,000
5
Beds
4
Baths
4,145
Sq Ft
$175/Sq Ft
Est. Value
About This Home
This home is located at 317 Morning Glory Trail Unit V, Powder Springs, GA 30127 and is currently estimated at $727,088, approximately $175 per square foot. 317 Morning Glory Trail Unit V is a home located in Cobb County with nearby schools including Vaughan Elementary School, Lost Mountain Middle School, and Harrison High School.
Ownership History
Date
Name
Owned For
Owner Type
Purchase Details
Closed on
Oct 21, 2002
Sold by
Cendant Mobility Financial Corp
Bought by
Stabler Roytunda and Stabler Darrell
Current Estimated Value
Home Financials for this Owner
Home Financials are based on the most recent Mortgage that was taken out on this home.
Original Mortgage
$299,100
Outstanding Balance
$124,671
Interest Rate
6.21%
Mortgage Type
New Conventional
Estimated Equity
$602,417
Purchase Details
Closed on
Aug 12, 2002
Sold by
Grace Timothy P and Grace Mary S
Bought by
Cendant Mobility Financial Corp
Purchase Details
Closed on
Jul 20, 2001
Sold by
Barrett Builders Inc
Bought by
Grace Timothy P and Grace Mary S
Home Financials for this Owner
Home Financials are based on the most recent Mortgage that was taken out on this home.
Original Mortgage
$275,000
Interest Rate
7.09%
Mortgage Type
New Conventional
Create a Home Valuation Report for This Property
The Home Valuation Report is an in-depth analysis detailing your home's value as well as a comparison with similar homes in the area
Home Values in the Area
Average Home Value in this Area
Purchase History
| Date | Buyer | Sale Price | Title Company |
|---|---|---|---|
| Stabler Roytunda | $407,000 | -- | |
| Cendant Mobility Financial Corp | $432,500 | -- | |
| Grace Timothy P | $470,000 | -- |
Source: Public Records
Mortgage History
| Date | Status | Borrower | Loan Amount |
|---|---|---|---|
| Open | Stabler Roytunda | $299,100 | |
| Previous Owner | Grace Timothy P | $275,000 |
Source: Public Records
Tax History Compared to Growth
Tax History
| Year | Tax Paid | Tax Assessment Tax Assessment Total Assessment is a certain percentage of the fair market value that is determined by local assessors to be the total taxable value of land and additions on the property. | Land | Improvement |
|---|---|---|---|---|
| 2025 | $7,583 | $304,488 | $60,000 | $244,488 |
| 2024 | $7,589 | $304,488 | $60,000 | $244,488 |
| 2023 | $6,039 | $258,076 | $38,000 | $220,076 |
| 2022 | $5,369 | $200,372 | $38,000 | $162,372 |
| 2021 | $5,369 | $200,372 | $38,000 | $162,372 |
| 2020 | $4,882 | $178,124 | $38,000 | $140,124 |
| 2019 | $4,882 | $178,124 | $38,000 | $140,124 |
| 2018 | $4,580 | $164,364 | $38,000 | $126,364 |
| 2017 | $4,361 | $164,364 | $38,000 | $126,364 |
| 2016 | $4,364 | $164,364 | $38,000 | $126,364 |
| 2015 | $4,180 | $151,452 | $35,700 | $115,752 |
| 2014 | $4,215 | $151,452 | $0 | $0 |
Source: Public Records
Map
Nearby Homes
- 725 Holland Rd
- 492 Teague Dr NW
- 154 Gold Leaf Trail
- 718 1st Cotton Dr
- 5585 Lavender Farms Rd
- 265 Holland Rd
- 5900 Pavillion Dr
- 695 Teague Dr NW
- 128 Courtland Cir
- 6049 Braidwood Close NW Unit 5
- 5904 Clairmont Way
- The Cameron Plan at Livingstone Park
- The Melissa Plan at Livingstone Park
- The Carie Plan at Livingstone Park
- The Whitney Plan at Livingstone Park
- The Sadie Plan at Livingstone Park
- 21 Nuttail Ln
- 582 Braidwood Dr NW
- 390 Scott Farm Dr
- 5954 Henley Dr
- 319 Morning Glory Trail
- 315 Morning Glory Trail Unit 5
- 586 Owl Creek Dr
- 588 Owl Creek Dr
- 313 Morning Glory Trail
- 0 Morning Glory Trail Unit 7457717
- 0 Morning Glory Trail Unit 7010261
- 0 Morning Glory Trail Unit 8133796
- 0 Morning Glory Trail Unit 8751127
- 0 Morning Glory Trail Unit 8077957
- 0 Morning Glory Trail Unit 3063420
- 0 Morning Glory Trail
- 321 Morning Glory Trail
- 318 Morning Glory Trail
- 584 Owl Creek Dr
- 320 Morning Glory Trail
- 590 Owl Creek Dr
- 316 Morning Glory Trail
- 570 Owl Creek Dr
- 572 Owl Creek Dr