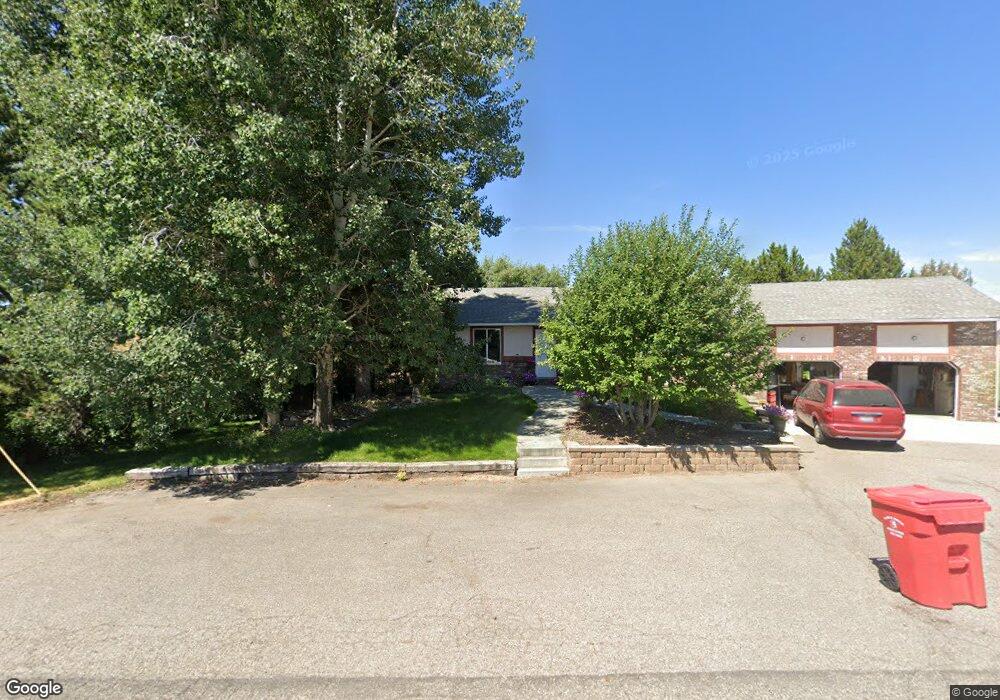
317 N Pine St Parker, ID 83438
Estimated Value: $314,000 - $383,982
3
Beds
2
Baths
1,300
Sq Ft
$271/Sq Ft
Est. Value
About This Home
This home is located at 317 N Pine St, Parker, ID 83438 and is currently estimated at $351,746, approximately $270 per square foot. 317 N Pine St is a home located in Fremont County with nearby schools including Parker-Egin Elementary School, South Fremont Junior High School, and South Fremont High School.
Ownership History
Date
Name
Owned For
Owner Type
Purchase Details
Closed on
Jan 20, 2021
Sold by
Hoskin Casey D and Sommer Charity
Bought by
Hoskin Casey Duane
Current Estimated Value
Home Financials for this Owner
Home Financials are based on the most recent Mortgage that was taken out on this home.
Original Mortgage
$177,750
Outstanding Balance
$144,122
Interest Rate
2.6%
Mortgage Type
New Conventional
Estimated Equity
$207,624
Purchase Details
Closed on
Jun 2, 2016
Sold by
Hoskin Casey D and Hoskin Casey D
Bought by
Hoskin Casey D and Sommer Chairity
Home Financials for this Owner
Home Financials are based on the most recent Mortgage that was taken out on this home.
Original Mortgage
$138,250
Interest Rate
3.61%
Mortgage Type
New Conventional
Purchase Details
Closed on
May 13, 2008
Sold by
Davis Jonathan and Davis Natalee
Bought by
Hoskin Casey D
Home Financials for this Owner
Home Financials are based on the most recent Mortgage that was taken out on this home.
Original Mortgage
$149,897
Interest Rate
5.88%
Mortgage Type
FHA
Create a Home Valuation Report for This Property
The Home Valuation Report is an in-depth analysis detailing your home's value as well as a comparison with similar homes in the area
Purchase History
| Date | Buyer | Sale Price | Title Company |
|---|---|---|---|
| Hoskin Casey Duane | -- | Alliance Ttl Rexburg Office | |
| Hoskin Casey D | -- | Alliance Title & Escrow | |
| Hoskin Casey D | -- | -- |
Source: Public Records
Mortgage History
| Date | Status | Borrower | Loan Amount |
|---|---|---|---|
| Open | Hoskin Casey Duane | $177,750 | |
| Closed | Hoskin Casey D | $138,250 | |
| Closed | Hoskin Casey D | $149,897 |
Source: Public Records
Tax History
| Year | Tax Paid | Tax Assessment Tax Assessment Total Assessment is a certain percentage of the fair market value that is determined by local assessors to be the total taxable value of land and additions on the property. | Land | Improvement |
|---|---|---|---|---|
| 2025 | $922 | $142,830 | $24,500 | $118,330 |
| 2024 | $909 | $137,182 | $24,500 | $112,682 |
| 2023 | $841 | $137,182 | $24,500 | $112,682 |
| 2022 | $1,101 | $108,752 | $24,500 | $84,252 |
| 2021 | $1,160 | $88,473 | $22,344 | $66,129 |
| 2020 | $1,144 | $81,132 | $22,344 | $58,788 |
| 2019 | $1,133 | $81,132 | $22,344 | $58,788 |
| 2018 | $1,007 | $64,022 | $18,620 | $45,402 |
| 2017 | $11 | $62,047 | $18,061 | $43,986 |
| 2016 | $982 | $54,551 | $18,061 | $36,490 |
| 2015 | $962 | $109,103 | $0 | $0 |
| 2014 | $763 | $54,551 | $0 | $0 |
| 2013 | $763 | $54,551 | $0 | $0 |
Source: Public Records
Map
Nearby Homes
- 319 N Pine St
- 201 N Center St
- 371 N 1900 E
- LOT 2 E 350 N
- LOT 4 E 350 N
- LOT 1 E 350 N
- LOT 3 E 350 N
- LOT 5 E 350 N
- 1120 Home Run Ave
- 1118 Home Run Ave
- 1112 Home Run Ave
- 2985 Edgewater Ln
- 2310 E Trails End
- Lot 1 Bl 3 Trapper Ln
- 545 Elm Ave Unit 18
- 415 Juniper View Ave
- TBD Fort Henry Estates
- TBD 8th St
- 745 W Main St
- 645 W 1st N
- 305 N Pine St
- 313 N Pine St
- 318 N Pine St
- 240 N Spruce St
- 300 N Pine St
- 232 N Spruce St
- 232 N Spruce St
- 300 N Pine St
- 233 N Pine St
- 205 N Pine St
- 321 N Center St
- 305 N Center St
- 311 N Center St
- 306 N Center St
- 223 N Center St
- 211 N Spruce St
- 38 W Juniper St
- 425 N Center St
- 437 N Center St
- 400 N Center St
Your Personal Tour Guide
Ask me questions while you tour the home.