
Buyer's Agent in 2021
Faith Ulate
Windermere Real Estate Whatcom
(360) 220-8685
4 in this area
83 Total Sales
Estimated Value: $806,000 - $844,000
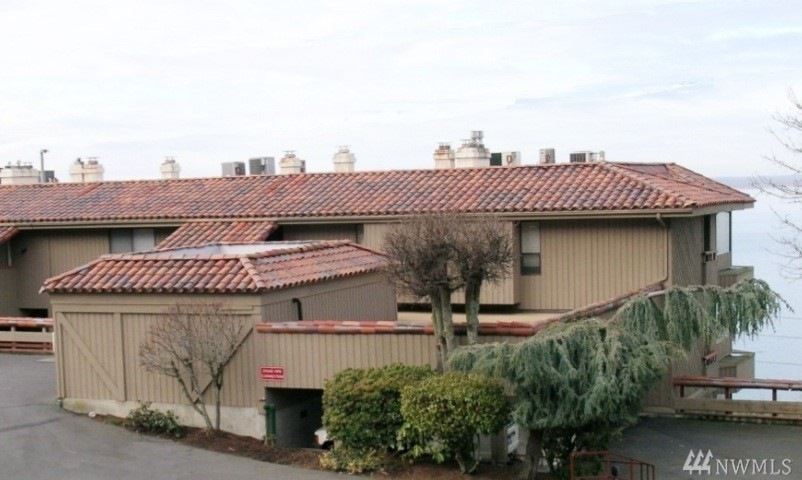
Beautiful Bellingham Bay views from this Cliffhouse condo. You will love being walking distance to Boulevard park and downtown Fairhaven. Comfortable 2 bedroom, 2 bathroom home with lots of natural light. Enjoy a cup of coffee on your private balcony overlooking the water. Nice gas fireplace, storage space and 2 car parking. These condos rarely come available. Location, location, location!
Source: Northwest Multiple Listing Service (NWMLS)
MLS#: NWM1847462
| Date | Buyer | Sale Price | Title Company |
|---|---|---|---|
| Caldwell Robin W | $650,000 | Whatcom Land Title | |
| Wiggs Debra | -- | Chicago Title Insurance |
| Date | Status | Borrower | Loan Amount |
|---|---|---|---|
| Closed | Wiggs Debra | $0 | |
| Closed | Wiggs Debra | $70,000 |
| Date | Event | Price | Change | Sq Ft Price |
|---|---|---|---|---|
| 09/30/2021 09/30/21 | Sold | $650,000 | 0.0% | $461 / Sq Ft |
| 09/30/2021 09/30/21 | For Sale | $650,000 | -- | $461 / Sq Ft |
| Year | Tax Paid | Tax Assessment Tax Assessment Total Assessment is a certain percentage of the fair market value that is determined by local assessors to be the total taxable value of land and additions on the property. | Land | Improvement |
|---|---|---|---|---|
| 2024 | $7,064 | $907,948 | $143,931 | $764,017 |
| 2023 | $7,064 | $907,948 | $143,931 | $764,017 |
| 2022 | $6,215 | $789,501 | $125,154 | $664,347 |
| 2021 | $5,726 | $669,070 | $106,063 | $563,007 |
| 2020 | $5,460 | $581,777 | $92,225 | $489,552 |
| 2019 | $4,710 | $536,200 | $85,000 | $451,200 |
| 2018 | $4,967 | $463,828 | $78,012 | $385,816 |
| 2017 | $4,534 | $418,175 | $70,320 | $347,855 |
| 2016 | $4,195 | $398,975 | $68,520 | $330,455 |
| 2015 | $3,949 | $384,240 | $65,820 | $318,420 |
| 2014 | -- | $350,000 | $60,000 | $290,000 |
| 2013 | -- | $350,000 | $60,000 | $290,000 |
Buyer's Agent in 2021
Faith Ulate
Windermere Real Estate Whatcom
(360) 220-8685
4 in this area
83 Total Sales
Source: Northwest Multiple Listing Service (NWMLS)
MLS Number: NWM1847462
APN: 380236-430251-0011
Disclaimer: Certain information contained herein is derived from information provided by parties other than Homes.com. All information provided is deemed reliable, but is not guaranteed to be accurate and should be independently verified.
![]() All data is obtained from various sources and may not have been verified by broker or MLS GRID. Supplied Open House Information is subject to change without notice. All information should be independently reviewed and verified for accuracy. Properties may or may not be listed by the office/agent presenting the information. Listing information is provided by the Northwest Multiple Listing Service (NWMLS). Property information is based on available data that may include MLS information, county records, and other sources. Listings marked with the 3 tree icon and provided by NWMLS. All properties are subject to prior sale or withdrawal. IDX information is provided exclusively for consumers’ personal noncommercial use, that it may not be used for any purpose other than to identify prospective properties consumers may be interested in purchasing, that the data is deemed reliable but is not guaranteed by MLS GRID. ©2025 NWMLS.
All data is obtained from various sources and may not have been verified by broker or MLS GRID. Supplied Open House Information is subject to change without notice. All information should be independently reviewed and verified for accuracy. Properties may or may not be listed by the office/agent presenting the information. Listing information is provided by the Northwest Multiple Listing Service (NWMLS). Property information is based on available data that may include MLS information, county records, and other sources. Listings marked with the 3 tree icon and provided by NWMLS. All properties are subject to prior sale or withdrawal. IDX information is provided exclusively for consumers’ personal noncommercial use, that it may not be used for any purpose other than to identify prospective properties consumers may be interested in purchasing, that the data is deemed reliable but is not guaranteed by MLS GRID. ©2025 NWMLS.
Based on information submitted to the MLS GRID