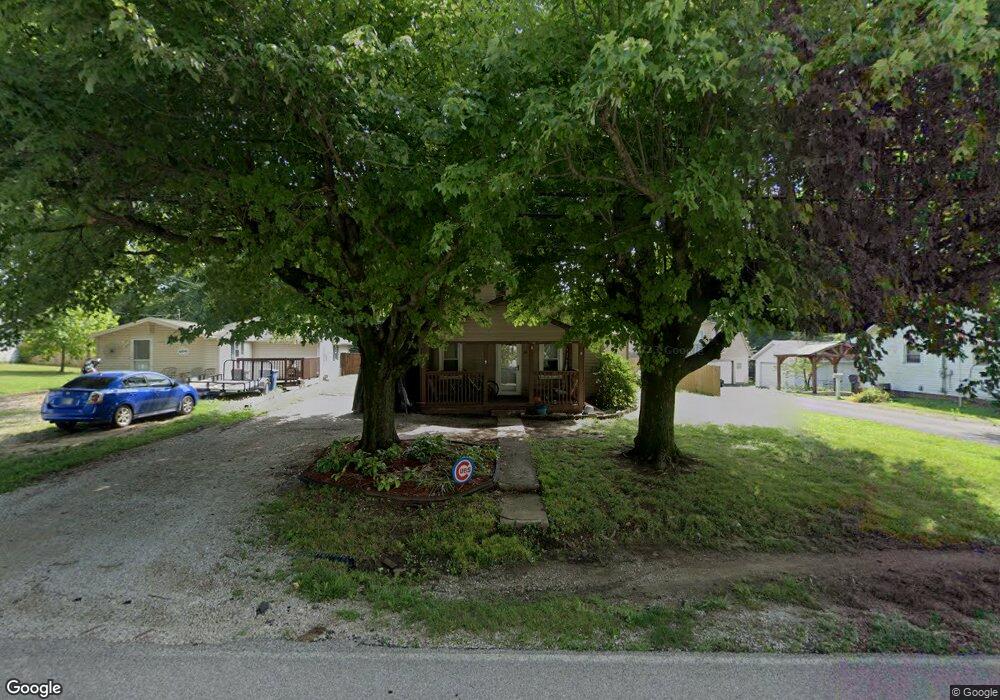
317 N State St Chandler, IN 47610
Estimated Value: $148,000 - $191,000
3
Beds
2
Baths
1,322
Sq Ft
$129/Sq Ft
Est. Value
About This Home
This home is located at 317 N State St, Chandler, IN 47610 and is currently estimated at $170,754, approximately $129 per square foot. 317 N State St is a home located in Warrick County with nearby schools including Chandler Elementary School, Castle North Middle School, and Boonville Middle School.
Ownership History
Date
Name
Owned For
Owner Type
Purchase Details
Closed on
Dec 29, 2015
Sold by
Whitsell Scott
Bought by
Young Christopher E
Current Estimated Value
Home Financials for this Owner
Home Financials are based on the most recent Mortgage that was taken out on this home.
Original Mortgage
$82,051
Outstanding Balance
$66,629
Interest Rate
4.62%
Mortgage Type
FHA
Estimated Equity
$104,125
Purchase Details
Closed on
Oct 28, 2011
Sold by
Byrd Jeffrey and Byrd Gina L
Bought by
Whitsell Scott
Home Financials for this Owner
Home Financials are based on the most recent Mortgage that was taken out on this home.
Original Mortgage
$74,970
Interest Rate
4.02%
Mortgage Type
New Conventional
Purchase Details
Closed on
Nov 21, 2006
Sold by
Byrd Gina L and Ingram Gina L
Bought by
Byrd Jeffrey and Byrd Gina L
Home Financials for this Owner
Home Financials are based on the most recent Mortgage that was taken out on this home.
Original Mortgage
$63,700
Interest Rate
6.47%
Mortgage Type
New Conventional
Create a Home Valuation Report for This Property
The Home Valuation Report is an in-depth analysis detailing your home's value as well as a comparison with similar homes in the area
Home Values in the Area
Average Home Value in this Area
Purchase History
| Date | Buyer | Sale Price | Title Company |
|---|---|---|---|
| Young Christopher E | -- | None Available | |
| Whitsell Scott | -- | None Available | |
| Byrd Jeffrey | -- | None Available |
Source: Public Records
Mortgage History
| Date | Status | Borrower | Loan Amount |
|---|---|---|---|
| Open | Young Christopher E | $82,051 | |
| Previous Owner | Whitsell Scott | $74,970 | |
| Previous Owner | Byrd Jeffrey | $63,700 |
Source: Public Records
Tax History Compared to Growth
Tax History
| Year | Tax Paid | Tax Assessment Tax Assessment Total Assessment is a certain percentage of the fair market value that is determined by local assessors to be the total taxable value of land and additions on the property. | Land | Improvement |
|---|---|---|---|---|
| 2024 | $501 | $86,000 | $10,900 | $75,100 |
| 2023 | $444 | $83,800 | $10,900 | $72,900 |
| 2022 | $397 | $79,100 | $8,500 | $70,600 |
| 2021 | $323 | $62,600 | $8,500 | $54,100 |
| 2020 | $353 | $66,000 | $8,500 | $57,500 |
| 2019 | $313 | $60,300 | $8,900 | $51,400 |
| 2018 | $285 | $57,000 | $8,900 | $48,100 |
| 2017 | $272 | $55,000 | $8,900 | $46,100 |
| 2016 | $255 | $52,800 | $8,900 | $43,900 |
| 2014 | $277 | $56,900 | $7,800 | $49,100 |
| 2013 | $240 | $53,100 | $7,800 | $45,300 |
Source: Public Records
Map
Nearby Homes
- 521 E Monroe Ave
- 817 N Illinois St
- 603 E Adams Ave
- 230 W Walnut St
- 508 W Jefferson Ave
- 509 Inderrieden Rd
- 216 S Kentucky Ave
- 125 Cortez Ct
- 1922 Hewins Rd
- 1054 Saddlebrooke Cir
- 1134 Saddlebrooke Cir
- 1214 Saddlebrooke Cir
- 326 Wabash Cir
- 0 Gardner Rd
- 340 Wabash Cir
- 450 Mallard Cir
- 435 Mallard Cir
- 8100 Gardner Rd
- 6855 Russell Place
- 1066 Squaw Creek Rd
- 317 N State St
- 317 1/2 N State St
- 303 N State St
- 407 N State St
- 333 N State St Unit 335
- 366 N State St
- 301 N State St
- 314 N 1st St
- 310 N 1st St
- 411 N State St
- 411 N State St
- 318 N State St
- 326 N State St
- 412 N 1st St
- 417 N State St
- 101 W Monroe Ave
- 310 N State St
- 310 N State St
- 225 N State St
- 319 N 1st St