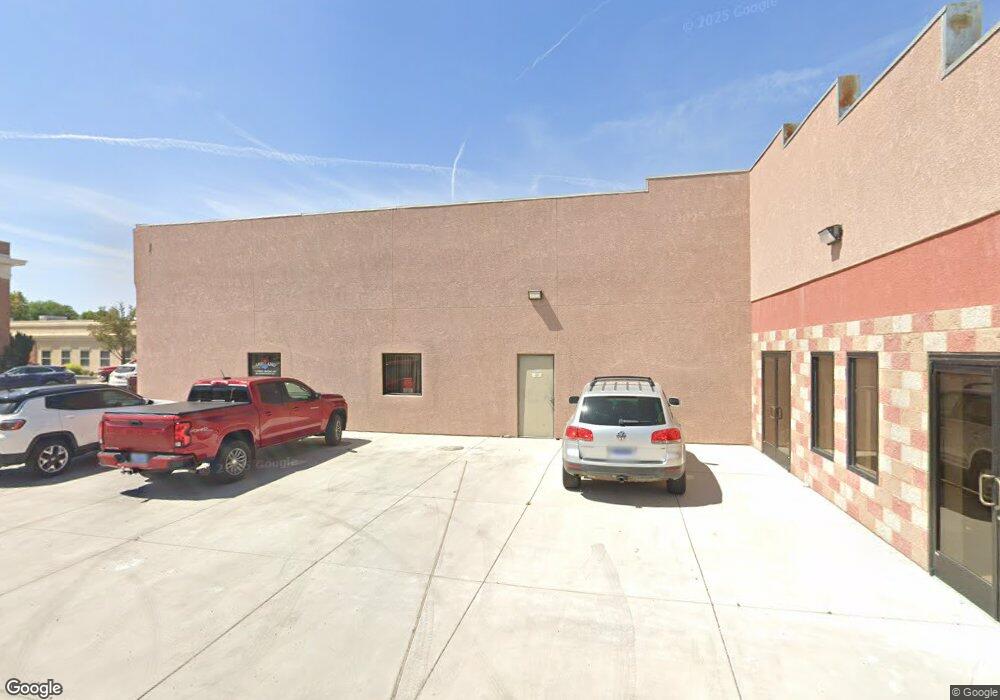
317 N West St Yerington, NV 89447
Estimated Value: $163,000 - $277,000
2
Beds
1
Bath
840
Sq Ft
$263/Sq Ft
Est. Value
About This Home
This home is located at 317 N West St, Yerington, NV 89447 and is currently estimated at $220,694, approximately $262 per square foot. 317 N West St is a home located in Lyon County with nearby schools including Yerington Elementary School, Yerington Intermediate School, and Yerington High School.
Ownership History
Date
Name
Owned For
Owner Type
Purchase Details
Closed on
Jun 5, 2018
Sold by
Madera Edgardo
Bought by
Lyon County
Current Estimated Value
Home Financials for this Owner
Home Financials are based on the most recent Mortgage that was taken out on this home.
Interest Rate
4.56%
Purchase Details
Closed on
Dec 16, 2011
Sold by
Savage Keith A and Savage Virginia L
Bought by
Madera Edgardo and Vonjaeger Nichole
Home Financials for this Owner
Home Financials are based on the most recent Mortgage that was taken out on this home.
Original Mortgage
$72,000
Interest Rate
3.94%
Mortgage Type
Seller Take Back
Purchase Details
Closed on
Jun 30, 2009
Sold by
Savage Keith A and Savage Virginia
Bought by
Savage Keith A and Savage Virginia L
Purchase Details
Closed on
Sep 12, 2007
Sold by
Lynch Betty L
Bought by
Savage Keith A and Savage Virginia
Create a Home Valuation Report for This Property
The Home Valuation Report is an in-depth analysis detailing your home's value as well as a comparison with similar homes in the area
Home Values in the Area
Average Home Value in this Area
Purchase History
| Date | Buyer | Sale Price | Title Company |
|---|---|---|---|
| Lyon County | $38,108 | -- | |
| Madera Edgardo | $75,000 | Title Service & Escrow | |
| Savage Keith A | -- | None Available | |
| Savage Keith A | $62,000 | Title Service & Escrow |
Source: Public Records
Mortgage History
| Date | Status | Borrower | Loan Amount |
|---|---|---|---|
| Closed | Lyon County | -- | |
| Previous Owner | Madera Edgardo | $72,000 |
Source: Public Records
Tax History Compared to Growth
Tax History
| Year | Tax Paid | Tax Assessment Tax Assessment Total Assessment is a certain percentage of the fair market value that is determined by local assessors to be the total taxable value of land and additions on the property. | Land | Improvement |
|---|---|---|---|---|
| 2025 | $474 | $42,437 | $31,500 | $10,937 |
| 2024 | $460 | $41,621 | $30,800 | $10,820 |
| 2023 | $460 | $40,756 | $30,800 | $9,956 |
| 2022 | $434 | $39,881 | $30,800 | $9,081 |
| 2021 | $421 | $14,316 | $5,600 | $8,716 |
| 2020 | $409 | $13,702 | $5,600 | $8,102 |
| 2019 | $397 | $13,305 | $5,600 | $7,705 |
| 2018 | $386 | $11,090 | $3,680 | $7,410 |
| 2017 | $374 | $10,976 | $3,680 | $7,296 |
| 2016 | $365 | $10,462 | $3,120 | $7,342 |
| 2015 | $364 | $10,287 | $3,120 | $7,167 |
| 2014 | $354 | $10,046 | $3,120 | $6,926 |
Source: Public Records
Map
Nearby Homes
- 115 Commercial Ave
- 500 W Goldfield Ave Unit 31
- 500 W Goldfield Ave Unit 32
- 500 W Goldfield Ave Unit 27
- 9 N Nevada St
- 0 S Whitacre St Unit 250001435
- 244 Valley Dr
- 0 Nevada 208
- 41 Nevada 208
- 317 Modesto St
- 204 Quail Run Dr
- 200 Quail Run Dr
- 234 S West St
- 311 S Main St
- 616 S Center St
- 321 S West St
- 329 S West St
- 21 Cherry Ln
- 13ac S Whitacre St
- 416 Paul Ave
- 313 N West St
- 303 N West St
- 329 N West St
- 318 N Whitacre St
- 308 N Whitacre St
- 316 N West St
- 318 N West St
- 212 Gallagher Ave
- 312 N West St
- 214 Gallagher Ave
- 306 N West St
- 0 Snyder Ave Unit 240004957
- 22 Snyder Ave
- 332 N West St
- 122 Gallagher Ave
- 403 N West St Unit 403 & 405 ABCD
- 403 N West St
- 201 & 203 Gallagher
- 203 Gallagher Ave
- 317 N Center St