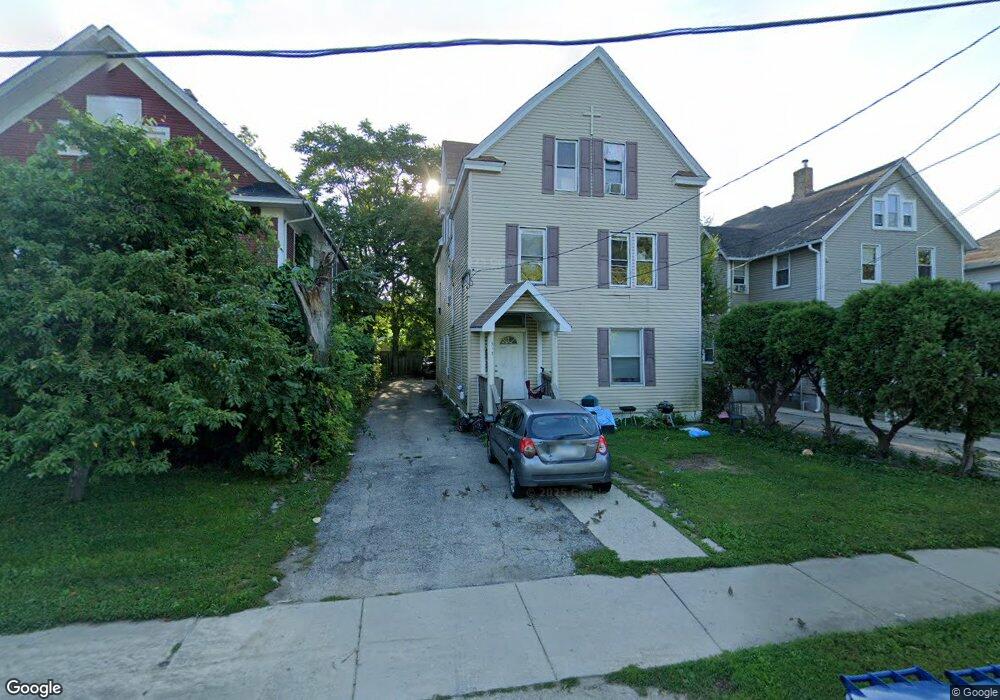
317 S Genesee St Waukegan, IL 60085
Downtown Waukegan NeighborhoodEstimated Value: $222,000 - $322,000
6
Beds
3
Baths
2,582
Sq Ft
$99/Sq Ft
Est. Value
About This Home
This home is located at 317 S Genesee St, Waukegan, IL 60085 and is currently estimated at $255,333, approximately $98 per square foot. 317 S Genesee St is a home located in Lake County with nearby schools including Carman-Buckner Elementary School, John R Lewis Middle School, and Waukegan High School.
Ownership History
Date
Name
Owned For
Owner Type
Purchase Details
Closed on
Aug 19, 2020
Sold by
Clear Capital Llc
Bought by
Clear Capital Core 1 Llc
Current Estimated Value
Purchase Details
Closed on
Jun 5, 2017
Sold by
Wyckoff Carla N
Bought by
Clear Capital Llc
Purchase Details
Closed on
Jan 13, 2015
Sold by
Dupree Richard C
Bought by
Veasley Tamikio N
Purchase Details
Closed on
Aug 27, 2012
Sold by
The Churchs House Of The New Testament
Bought by
Dupree Richard and Dupree Callie
Create a Home Valuation Report for This Property
The Home Valuation Report is an in-depth analysis detailing your home's value as well as a comparison with similar homes in the area
Home Values in the Area
Average Home Value in this Area
Purchase History
| Date | Buyer | Sale Price | Title Company |
|---|---|---|---|
| Clear Capital Core 1 Llc | -- | Attorney | |
| Clear Capital Llc | -- | Attorney | |
| Veasley Tamikio N | -- | None Available | |
| Dupree Richard | -- | None Available |
Source: Public Records
Tax History Compared to Growth
Tax History
| Year | Tax Paid | Tax Assessment Tax Assessment Total Assessment is a certain percentage of the fair market value that is determined by local assessors to be the total taxable value of land and additions on the property. | Land | Improvement |
|---|---|---|---|---|
| 2024 | $5,319 | $62,596 | $7,582 | $55,014 |
| 2023 | $3,204 | $56,403 | $6,788 | $49,615 |
| 2022 | $3,204 | $32,771 | $4,416 | $28,355 |
| 2021 | $3,387 | $32,485 | $4,377 | $28,108 |
| 2020 | $3,431 | $30,264 | $4,078 | $26,186 |
| 2019 | $3,739 | $30,034 | $3,737 | $26,297 |
| 2018 | $894 | $6,915 | $3,332 | $3,583 |
| 2017 | $877 | $6,118 | $2,948 | $3,170 |
| 2016 | $2,998 | $19,403 | $3,660 | $15,743 |
| 2015 | $2,934 | $17,366 | $3,276 | $14,090 |
| 2014 | $4,308 | $25,464 | $3,464 | $22,000 |
| 2012 | $5,339 | $27,589 | $3,754 | $23,835 |
Source: Public Records
Map
Nearby Homes
- 502 Belvidere Rd
- 547 S Martin Luther King Junior Ave
- 215 S Park Ave
- 557 W Water St
- 613 Clarke Ave
- 305 Besley Place
- 408 Besley Place
- 613 Washington St
- 600 Sunderlin St
- 710 S Martin Luther King Junior Ave
- 222 Grand Ave
- 515 May St
- 446 S Jackson St
- 631 8th St
- 426 Julian St
- 842 Wadsworth Ave
- 815 Prescott St
- 924 Lenox Ave
- 306 Oak Crest St
- 428 N Poplar St
- 313 S Genesee St
- 313 S Genesee St Unit 2
- 321 S Genesee St
- 323 S Genesee St
- 309 S Genesee St
- 325 S Genesee St
- 307 S Genesee St
- 318 S Sheridan Rd
- 316 S Sheridan Rd
- 322 S Sheridan Rd
- 327 S Genesee St
- 112 Liberty St
- 324 S Sheridan Rd
- 308 S Sheridan Rd
- 326 S Sheridan Rd
- 331 S Genesee St
- 314 S Genesee St
- 316 S Genesee St
- 324 S Genesee St
- 326 S Genesee St