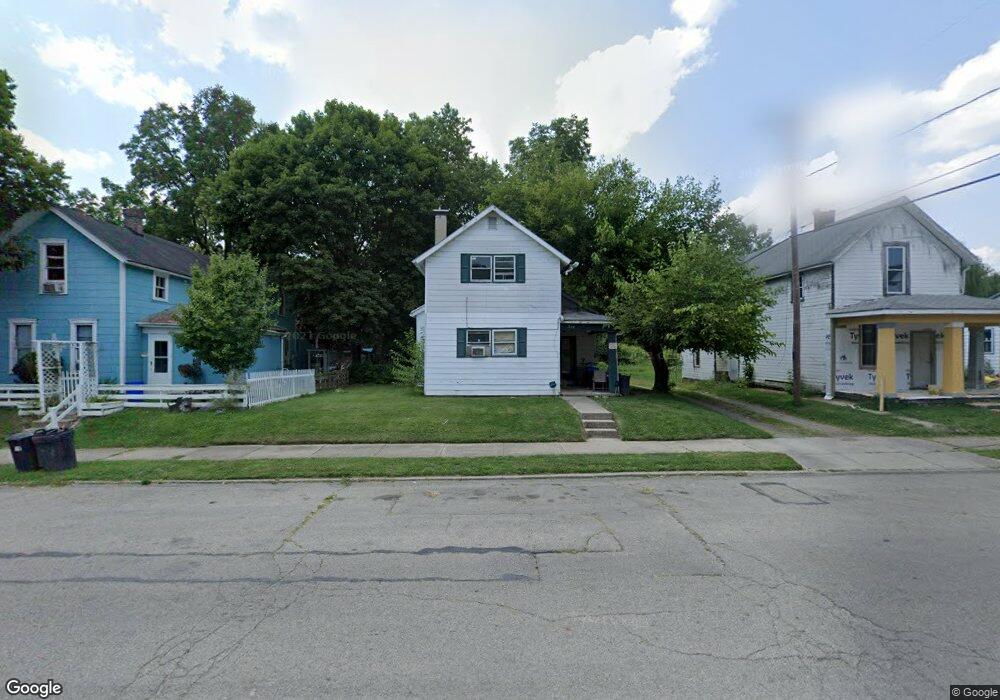
317 S Shaffer St Springfield, OH 45506
Estimated Value: $78,000 - $124,000
2
Beds
1
Bath
1,020
Sq Ft
$90/Sq Ft
Est. Value
About This Home
This home is located at 317 S Shaffer St, Springfield, OH 45506 and is currently estimated at $92,018, approximately $90 per square foot. 317 S Shaffer St is a home located in Clark County with nearby schools including Fulton Elementary School, Roosevelt Middle School, and Springfield High School.
Ownership History
Date
Name
Owned For
Owner Type
Purchase Details
Closed on
Oct 11, 2007
Sold by
Sheley John E
Bought by
Boyd Galen
Current Estimated Value
Purchase Details
Closed on
Sep 13, 2007
Sold by
The Bank Of New York
Bought by
Boyd Galen and Sheley John E
Purchase Details
Closed on
Sep 22, 2006
Sold by
Sherman Leslie
Bought by
Bank One Na and Amortizing Residential Collateral Trust
Purchase Details
Closed on
Sep 25, 1998
Sold by
Barnett Warren Eugene and Nevius Barnett Mary Lynn
Bought by
Sherman Leslie
Home Financials for this Owner
Home Financials are based on the most recent Mortgage that was taken out on this home.
Original Mortgage
$29,625
Interest Rate
11.45%
Mortgage Type
Purchase Money Mortgage
Purchase Details
Closed on
Feb 18, 1993
Create a Home Valuation Report for This Property
The Home Valuation Report is an in-depth analysis detailing your home's value as well as a comparison with similar homes in the area
Home Values in the Area
Average Home Value in this Area
Purchase History
| Date | Buyer | Sale Price | Title Company |
|---|---|---|---|
| Boyd Galen | -- | None Available | |
| Boyd Galen | $13,000 | Titlequest Agency Inc | |
| Bank One Na | $20,000 | Attorney | |
| Sherman Leslie | $39,500 | -- | |
| -- | $22,600 | -- |
Source: Public Records
Mortgage History
| Date | Status | Borrower | Loan Amount |
|---|---|---|---|
| Previous Owner | Sherman Leslie | $29,625 | |
| Closed | Sherman Leslie | $7,900 |
Source: Public Records
Tax History
| Year | Tax Paid | Tax Assessment Tax Assessment Total Assessment is a certain percentage of the fair market value that is determined by local assessors to be the total taxable value of land and additions on the property. | Land | Improvement |
|---|---|---|---|---|
| 2025 | $520 | $15,580 | $3,520 | $12,060 |
| 2024 | $507 | $10,260 | $2,700 | $7,560 |
| 2023 | $507 | $10,260 | $2,700 | $7,560 |
| 2022 | $519 | $10,260 | $2,700 | $7,560 |
| 2021 | $528 | $9,610 | $2,520 | $7,090 |
| 2020 | $529 | $9,610 | $2,520 | $7,090 |
| 2019 | $531 | $9,610 | $2,520 | $7,090 |
| 2018 | $570 | $9,910 | $2,100 | $7,810 |
| 2017 | $570 | $9,902 | $2,097 | $7,805 |
| 2016 | $570 | $9,902 | $2,097 | $7,805 |
| 2015 | $1,719 | $9,902 | $2,097 | $7,805 |
| 2014 | $898 | $9,902 | $2,097 | $7,805 |
| 2013 | $573 | $9,902 | $2,097 | $7,805 |
Source: Public Records
Map
Nearby Homes
- 709-711 W Mulberry St
- 525 S Light St
- 659 W Mulberry St Unit 661
- 727 W High St
- 1124 W Mulberry St
- 830 Dibert Ave
- 1230 W Pleasant St
- 1205 W High St
- 1225 W High St
- 802 Innisfallen Ave
- 1002 S Yellow Springs St
- 101`103 N Western
- 1362 W Mulberry St Unit 1364
- 929 S Western Ave
- 1374 W Mulberry St
- 410 W Liberty St
- 239 N Shaffer St
- 222 N Race St Unit 224
- 1417 W Main St
- 0 Montgomery Ave
- 323 S Shaffer St Unit 325
- 315 S Shaffer St
- 327 S Shaffer St
- 309 S Shaffer St
- 826 W Mulberry St
- 817 W Jefferson St
- 809 W Jefferson St
- 738 W Mulberry St
- 141-143 W Mulberry St
- 501-503 W Mulberry St
- 141 W Mulberry St
- 821 W Jefferson St
- 737 W Jefferson St
- 823 W Jefferson St
- 830 W Mulberry St
- 734 W Mulberry St
- 733 W Jefferson St
- 827 W Jefferson St
- 803 W Mulberry St
- 801 W Mulberry St
Your Personal Tour Guide
Ask me questions while you tour the home.