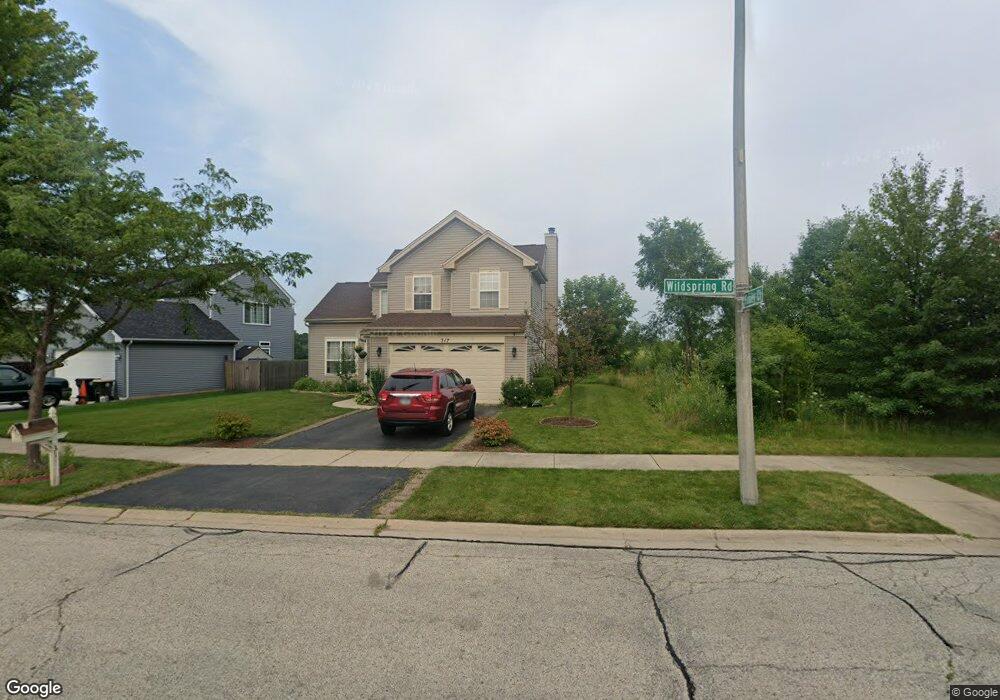
317 S Wildspring Rd Round Lake, IL 60073
Estimated Value: $340,000 - $359,000
3
Beds
3
Baths
1,867
Sq Ft
$188/Sq Ft
Est. Value
About This Home
This home is located at 317 S Wildspring Rd, Round Lake, IL 60073 and is currently estimated at $350,956, approximately $187 per square foot. 317 S Wildspring Rd is a home located in Lake County with nearby schools including Village Elementary School, John T. Magee Middle School, and Round Lake High School.
Ownership History
Date
Name
Owned For
Owner Type
Purchase Details
Closed on
Mar 25, 2004
Sold by
Dinh Hai D and Lam Christine
Bought by
Rodriguez Marco A and Cuevas Milady
Current Estimated Value
Home Financials for this Owner
Home Financials are based on the most recent Mortgage that was taken out on this home.
Original Mortgage
$199,500
Interest Rate
7.3%
Mortgage Type
Unknown
Purchase Details
Closed on
May 30, 1999
Sold by
Dinh Hai D and Dinh Hien Duy
Bought by
Dinh Hai D and Lam Christine
Home Financials for this Owner
Home Financials are based on the most recent Mortgage that was taken out on this home.
Original Mortgage
$144,000
Interest Rate
6.99%
Purchase Details
Closed on
Apr 30, 1999
Sold by
Kimball Hill Inc
Bought by
Dinh Hai D and Dinh Hien Duy
Home Financials for this Owner
Home Financials are based on the most recent Mortgage that was taken out on this home.
Original Mortgage
$144,000
Interest Rate
6.99%
Create a Home Valuation Report for This Property
The Home Valuation Report is an in-depth analysis detailing your home's value as well as a comparison with similar homes in the area
Home Values in the Area
Average Home Value in this Area
Purchase History
| Date | Buyer | Sale Price | Title Company |
|---|---|---|---|
| Rodriguez Marco A | $210,000 | Ticor Title Insurance Co | |
| Dinh Hai D | -- | Chicago Title Insurance Co | |
| Dinh Hai D | $160,000 | Stewart Title |
Source: Public Records
Mortgage History
| Date | Status | Borrower | Loan Amount |
|---|---|---|---|
| Previous Owner | Rodriguez Marco A | $199,500 | |
| Previous Owner | Dinh Hai D | $144,000 |
Source: Public Records
Tax History Compared to Growth
Tax History
| Year | Tax Paid | Tax Assessment Tax Assessment Total Assessment is a certain percentage of the fair market value that is determined by local assessors to be the total taxable value of land and additions on the property. | Land | Improvement |
|---|---|---|---|---|
| 2024 | $7,856 | $93,013 | $15,233 | $77,780 |
| 2023 | $7,262 | $85,364 | $13,980 | $71,384 |
| 2022 | $7,262 | $76,107 | $10,251 | $65,856 |
| 2021 | $7,673 | $73,152 | $9,853 | $63,299 |
| 2020 | $7,339 | $69,602 | $9,375 | $60,227 |
| 2019 | $7,151 | $66,778 | $8,995 | $57,783 |
| 2018 | $7,399 | $61,458 | $12,138 | $49,320 |
| 2017 | $7,258 | $57,811 | $11,418 | $46,393 |
| 2016 | $6,978 | $53,366 | $10,540 | $42,826 |
| 2015 | $6,729 | $48,754 | $9,629 | $39,125 |
| 2014 | $6,643 | $49,347 | $8,631 | $40,716 |
| 2012 | $6,644 | $51,537 | $9,014 | $42,523 |
Source: Public Records
Map
Nearby Homes
- 472 W Savoy Dr
- 504 W Forest Ave
- 33 S Treehouse Ln Unit 73
- 602 S Rosehall Ln
- 321 W Whispering Oaks Ln Unit 336
- 0 S Cedar Lake Rd Unit MRD12365608
- 124 W Buckingham Dr Unit 134
- 30 S Macgillis Dr Unit 201
- 47 S Treehouse Ln Unit 83
- 337 W Treehouse Ln Unit 112
- 13 Lincoln Ave
- 714 S Rosehall Ln Unit 3
- 108 Lincoln Ave
- 110 Lincoln Ave
- 801 S Parkside Dr Unit 4
- 407 W Waterbury Dr
- 175 Davis Ct
- 123 E Pineview Dr
- 345 W Asbury Dr
- 121 Highmoor Dr
- 307 S Wildspring Rd
- 299 S Wildspring Rd
- 360 W Honey Ct
- 363 W Honey Ct Unit 4
- 291 S Wildspring Rd Unit 3
- 290 S Wildspring Rd Unit 3
- 371 W Honey Ct
- 370 W Honey Ct
- 364 W Sweet Clover Rd
- 284 S Wildspring Rd
- 283 S Wildspring Rd
- 379 W Honey Ct
- 378 W Honey Ct
- 278 S Wildspring Rd
- 374 W Sweet Clover Rd
- 375 W Honey Ct Unit 4
- 275 S Quail Hollow Ct
- 280 S Quail Hollow Ct
- 277 S Wildspring Rd
- 325 W Weeping Willow Rd