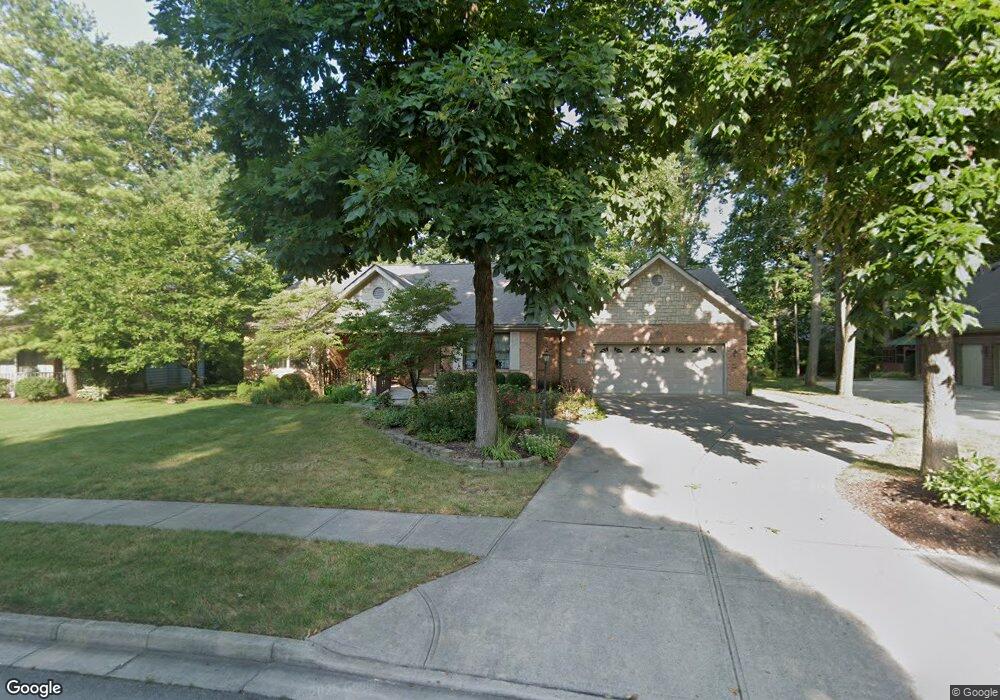
317 Shady Tree Ct Clayton, OH 45315
Estimated Value: $417,000 - $490,000
3
Beds
4
Baths
2,352
Sq Ft
$190/Sq Ft
Est. Value
About This Home
This home is located at 317 Shady Tree Ct, Clayton, OH 45315 and is currently estimated at $445,738, approximately $189 per square foot. 317 Shady Tree Ct is a home located in Montgomery County with nearby schools including Englewood Hills Elementary School, Northmont High School, and Trotwood Preparatory & Fitness Academy.
Ownership History
Date
Name
Owned For
Owner Type
Purchase Details
Closed on
Oct 11, 2007
Sold by
Magee Mollie S and Magee Mark A
Bought by
Prass Robert E and Prass Ann C
Current Estimated Value
Home Financials for this Owner
Home Financials are based on the most recent Mortgage that was taken out on this home.
Original Mortgage
$180,000
Outstanding Balance
$113,075
Interest Rate
6.33%
Mortgage Type
Purchase Money Mortgage
Estimated Equity
$332,663
Purchase Details
Closed on
Feb 19, 2007
Sold by
Magee Mark Alan and Magee Mollie Sue
Bought by
Magee Mollie S and Magee Mark A
Purchase Details
Closed on
Oct 31, 1997
Sold by
Becknell Gary M and Becknell Joan
Bought by
Magee Mark Alan and Magee Mollie Sue
Purchase Details
Closed on
Jun 25, 1996
Sold by
G & K Investments
Bought by
Becknell Gary M and Becknell Joan
Create a Home Valuation Report for This Property
The Home Valuation Report is an in-depth analysis detailing your home's value as well as a comparison with similar homes in the area
Home Values in the Area
Average Home Value in this Area
Purchase History
| Date | Buyer | Sale Price | Title Company |
|---|---|---|---|
| Prass Robert E | $290,000 | Attorney | |
| Magee Mollie S | -- | None Available | |
| Magee Mark Alan | -- | Attorney | |
| Magee Mark Alan | $40,000 | -- | |
| Becknell Gary M | $39,400 | -- |
Source: Public Records
Mortgage History
| Date | Status | Borrower | Loan Amount |
|---|---|---|---|
| Open | Prass Robert E | $180,000 |
Source: Public Records
Tax History Compared to Growth
Tax History
| Year | Tax Paid | Tax Assessment Tax Assessment Total Assessment is a certain percentage of the fair market value that is determined by local assessors to be the total taxable value of land and additions on the property. | Land | Improvement |
|---|---|---|---|---|
| 2024 | $7,461 | $140,440 | $19,850 | $120,590 |
| 2023 | $7,461 | $140,440 | $19,850 | $120,590 |
| 2022 | $7,034 | $104,020 | $14,700 | $89,320 |
| 2021 | $7,054 | $104,020 | $14,700 | $89,320 |
| 2020 | $6,927 | $104,020 | $14,700 | $89,320 |
| 2019 | $6,840 | $93,140 | $14,700 | $78,440 |
| 2018 | $6,715 | $93,140 | $14,700 | $78,440 |
| 2017 | $6,669 | $93,140 | $14,700 | $78,440 |
| 2016 | $6,306 | $87,150 | $14,700 | $72,450 |
| 2015 | $5,764 | $87,150 | $14,700 | $72,450 |
| 2014 | $5,764 | $87,150 | $14,700 | $72,450 |
| 2012 | -- | $91,720 | $19,250 | $72,470 |
Source: Public Records
Map
Nearby Homes
- 306 Pauly Dr
- 108 Denwood Trail
- 4245 W Wenger Rd
- 900 Moonlight Dr
- 830 W Wenger Rd
- 250 Winter Creek Ct
- 881 Sunset Dr
- 534 Unger Ave
- 1003 Sunset Dr
- 206 Gardengrove Way
- 510 Rohr Ln
- 604 Heather St
- 206 Lodestone Dr
- 408 W Herr St
- 505 Durst Dr
- 109 Silverstone Dr
- 4005 Clearstream Way
- 510 Lambert Ln
- 803 Albert St
- 104 Silverstone Dr
- 319 Shady Tree Ct
- 315 Shady Tree Ct
- 308 Chinkapin Cir
- 306 Chinkapin Cir
- 313 Shady Tree Ct
- 312 Shady Tree Ct
- 304 Chinkapin Cir
- 310 Chinkapin Cir
- 321 Shady Tree Ct
- 318 Shady Tree Ct
- 320 Shady Tree Ct
- 302 Chinkapin Cir
- 311 Shady Tree Ct
- 1 Deeter Dr
- 0 Deeter Unit 497405
- 0 Deeter Unit 497406
- 0 Deeter Unit 327689
- 0 Deeter Unit 327686
- 164 Deeter Dr
- 308 Shady Tree Ct