NOT LISTED FOR SALE

317 W Walnut St Whitewright, TX 75491

Estimated Value: $166,000 - $178,286

5 Beds
2 Baths
2,700 Sq Ft
$64/Sq Ft Est. Value

Last Sold September 16, 2022

Current estimated payment $1,110/month

About This Home

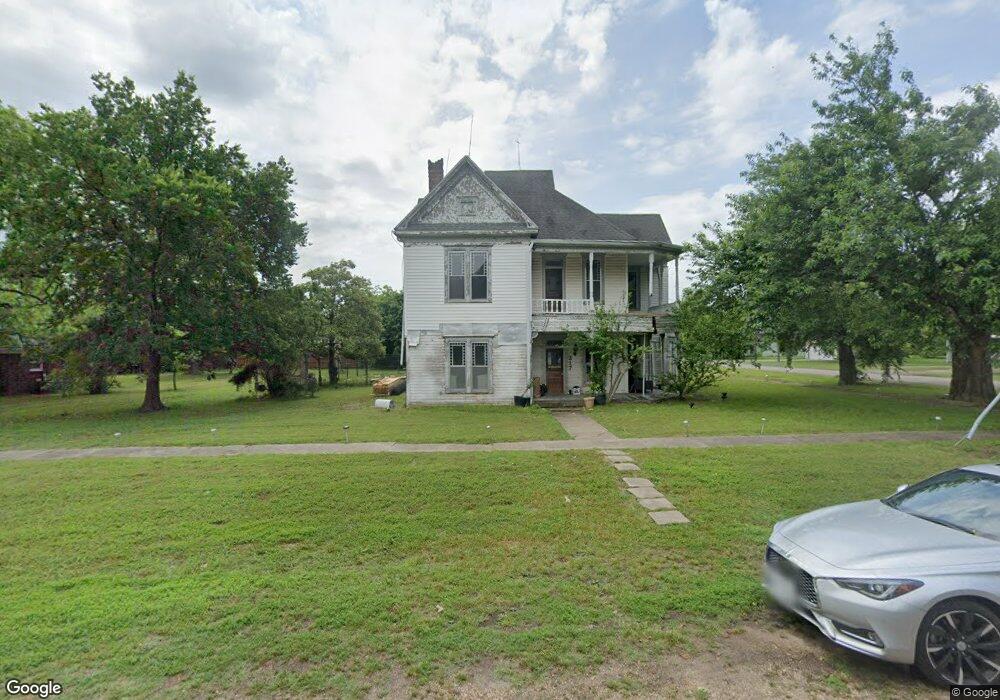
Victorian Lady built in 1900 with 5 bedrooms, 2 baths and oversized garage offering turn of the Century charm hidden beneath the desire to be unveiled. Large rooms adorn her 2700sf and gracious entry way and stairwell. 4 fireplaces, stained glass and gingerbread trim. Original doors with porcelain knobs, wood trim and claw feet tubs. She wears a wrap around porch like a ruffle on an apron in need of mending. Please be kind when viewing and consider bringing her back to life.

Ownership History

Date Name Owned For Owner Type

Purchase Details

Closed on
Feb 18, 2023
Sold by
Dyar Olivia C
Bought by
Dyar Sean Patrick
Current Estimated Value
$172,143

Purchase Details

Closed on
Jan 17, 2023
Sold by
Dyar Sean
Bought by
Dyar Olivia

Purchase Details

Listed on
Aug 2, 2022
Closed on
Sep 15, 2022
Sold by
Lindsay Armstrong
Bought by
Dyar Sean
Seller's Agent
Sheri Kent
DFW Elite
Buyer's Agent
Beverly Lanham
Coldwell Banker Realty
List Price
$149,900
Views
93

Home Financials for this Owner

Home Financials are based on the most recent Mortgage that was taken out on this home.
Avg. Annual Appreciation
6.81%
Source: Public Records

Range of Values:

--
Value Increase
--
Percent Increase
--
Adjusted for Inflation
Collateral Analytics

Collateral Analytics Collateral Analytics AVMs (Automated Valuation Model) employ a number of statistical approaches combined with neighborhood-specific comparable selection guarantees the most up-to-date and precise valuations.

Not Available

Collateral Analytics does not have data for the current month. Please view the chart for historical values.

ICE

ICE Mortgage Technology ICE Mortgage Technology’s AVM (Automated Valuation Model) is a state-of-the-art online residential property valuation tool that provides a quick and accurate estimate of the value of almost any home in the U.S.

Not Available

ICE Mortgage Technology does not have data for the current month. Please view the chart for historical values.

First American

First American First American Data & Analytics’ next-generation AVM combines unrivaled data assets with a blended ensemble of valuation models to produce highly accurate, reliable valuations you can trust.

Not Available

First American does not have data for the current month. Please view the chart for historical values.

Quantarium

Quantarium Quantarium’s valuation service, repeatedly proven the industry’s most accurate and comprehensive, is supercharged with a self-learning and auto-tuning AI engine that continually becomes smarter and more accurate as it processes daily inputs from the industry’s leading RE data lake.

Not Available

Quantarium does not have data for the current month. Please view the chart for historical values.

Average Value
Not Available
List Price
Sold Price
Create a Home Valuation Report for This Property
The Home Valuation Report is an in-depth analysis detailing your home's value as well as a comparison with similar homes in the area

Home Values in the Area

Source: Public Records

Average Home Value in this Area


Source: Public Records

Purchase History

Date Buyer Sale Price Title Company
Dyar Sean Patrick -- --
Dyar Olivia -- Red River Title
Dyar Sean -- Red River Title
Source: Public Records

Property History

Date Event Price List to Sale Price per Sq Ft Prior Sale
09/16/2022 09/16/22 Sold -- -- -- View Prior Sale
09/02/2022 09/02/22 Pending -- -- --
08/30/2022 08/30/22 Price Changed $139,500 -6.9% $52 / Sq Ft
08/02/2022 08/02/22 For Sale $149,900 -- $56 / Sq Ft

Tax History Compared to Growth

Source: Public Records

Tax History

Year Tax Paid Tax Assessment Tax Assessment Total Assessment is a certain percentage of the fair market value that is determined by local assessors to be the total taxable value of land and additions on the property. Land Improvement
2025 $2,406 $126,292 $69,630 $56,662
2024 $2,385 $125,831 $65,032 $60,799
2023 $2,398 $126,045 $50,580 $75,465
2022 $4,939 $231,620 $39,192 $192,428
2021 $4,256 $183,102 $28,251 $154,851
2020 $3,528 $141,966 $17,800 $124,166
2019 $2,921 $113,110 $15,024 $98,086
2018 $2,964 $111,750 $15,024 $96,726
2017 $3,227 $144,127 $15,024 $129,103
2016 $2,934 $139,914 $9,616 $130,298
2015 $0 $124,485 $9,475 $115,010
2014 -- $98,890 $9,475 $89,415
Source: Public Records

Agents Affiliated with this Home

  • Section Image
  • Section Image
See All Agents

Map