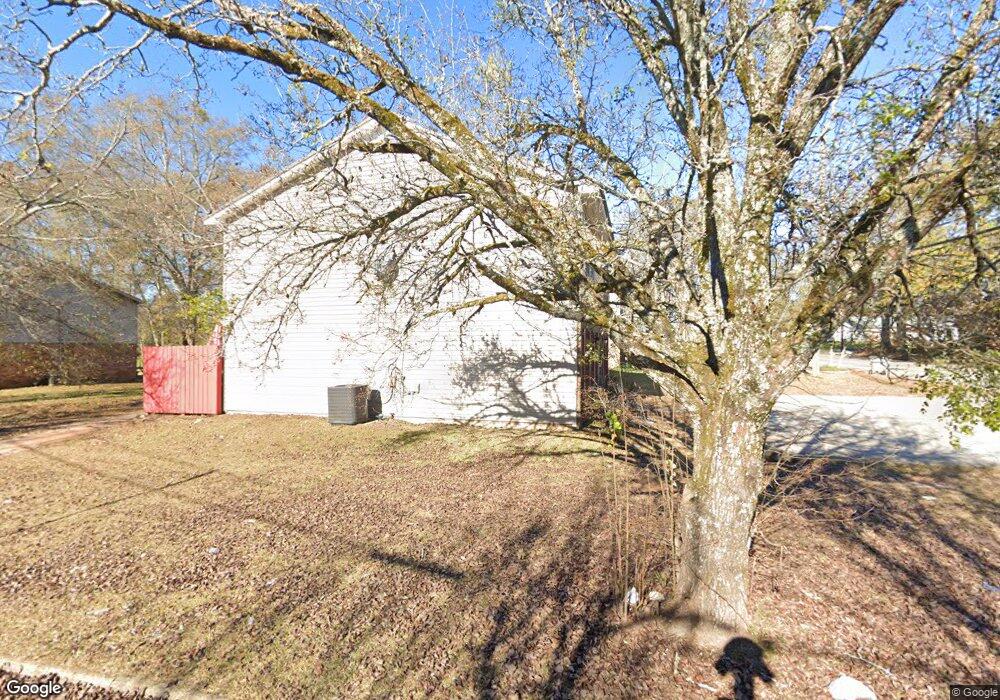
317 Youngs Mill Rd Lagrange, GA 30241
Estimated Value: $186,000 - $253,885
4
Beds
3
Baths
2,048
Sq Ft
$101/Sq Ft
Est. Value
About This Home
This home is located at 317 Youngs Mill Rd, Lagrange, GA 30241 and is currently estimated at $207,221, approximately $101 per square foot. 317 Youngs Mill Rd is a home located in Troup County with nearby schools including Franklin Forest Elementary School, Hollis Hand Elementary School, and Ethel W. Kight Elementary School.
Ownership History
Date
Name
Owned For
Owner Type
Purchase Details
Closed on
Jun 20, 2000
Sold by
Susan Knox Hofer Etal
Bought by
Anderson Wilma
Current Estimated Value
Purchase Details
Closed on
May 17, 2000
Sold by
Elizabeth Sheppard Green
Bought by
Susan Knox Hofer Etal
Purchase Details
Closed on
Dec 31, 1997
Sold by
Richland
Bought by
Elizabeth Sheppard Green
Purchase Details
Closed on
Jul 2, 1996
Sold by
Laurie Benjamin and Laurie Yates
Bought by
Richland
Purchase Details
Closed on
Jul 1, 1996
Sold by
Ben Yates
Bought by
Laurie Benjamin and Laurie Yates
Purchase Details
Closed on
Jan 2, 1992
Sold by
Nellie Yates
Bought by
Ben Yates
Purchase Details
Closed on
Feb 1, 1983
Sold by
Gerald Bowie
Bought by
Nellie Yates
Purchase Details
Closed on
Jan 27, 1981
Sold by
William Mcclellan and On Birkeli
Bought by
Gerald Bowie
Purchase Details
Closed on
Jan 31, 1980
Sold by
Steve Langford Etal
Bought by
William Mcclellan and On Birkeli
Create a Home Valuation Report for This Property
The Home Valuation Report is an in-depth analysis detailing your home's value as well as a comparison with similar homes in the area
Purchase History
| Date | Buyer | Sale Price | Title Company |
|---|---|---|---|
| Anderson Wilma | $190,000 | -- | |
| Susan Knox Hofer Etal | -- | -- | |
| Elizabeth Sheppard Green | $179,000 | -- | |
| Richland | -- | -- | |
| Laurie Benjamin | -- | -- | |
| Ben Yates | -- | -- | |
| Nellie Yates | $11,500 | -- | |
| Gerald Bowie | -- | -- | |
| William Mcclellan | -- | -- |
Source: Public Records
Tax History Compared to Growth
Tax History
| Year | Tax Paid | Tax Assessment Tax Assessment Total Assessment is a certain percentage of the fair market value that is determined by local assessors to be the total taxable value of land and additions on the property. | Land | Improvement |
|---|---|---|---|---|
| 2025 | $1,611 | $66,200 | $4,000 | $62,200 |
| 2024 | $1,611 | $59,080 | $4,000 | $55,080 |
| 2023 | $1,411 | $51,720 | $4,000 | $47,720 |
| 2022 | $1,358 | $48,640 | $4,000 | $44,640 |
| 2021 | $1,068 | $35,400 | $4,000 | $31,400 |
| 2020 | $1,068 | $35,400 | $4,000 | $31,400 |
| 2019 | $854 | $28,320 | $4,000 | $24,320 |
| 2018 | $854 | $28,320 | $4,000 | $24,320 |
| 2017 | $854 | $28,320 | $4,000 | $24,320 |
| 2016 | $830 | $27,509 | $4,000 | $23,509 |
| 2015 | $831 | $27,509 | $4,000 | $23,509 |
| 2014 | $795 | $26,272 | $4,000 | $22,272 |
| 2013 | -- | $28,248 | $4,000 | $24,248 |
Source: Public Records
Map
Nearby Homes
- 101 Lenox Cir
- 305 Lenox Cir
- 121 Ct
- 0 N Barnard Ave
- 130 Clara Jean Ct
- 210 Hearthstone Dr
- 212 Cleveland Dr
- 101 Sarah Ln
- 509 Youngs Mill Rd
- 227 River Meadow Dr Unit H14
- 227 River Meadow Dr
- 219 River Meadow Dr
- 412 Sweetwood Ct Unit A36
- 104 Sheila St
- 793 Celebration Blvd
- 105 Ridgefield Dr
- 5 Curran Ave
- 112 Celebration Blvd
- 113 Woodridge Cir
- 121 Woodridge Cir
- 0 Lafayette Parkway Davis Unit 40 ACRES 10415111
- 0 Lafayette Parkway Davis 40 Acres Unit 10415111
- 325 Youngs Mill Rd
- 100 102 Lafayette Ct
- 307 Youngs Mill Rd
- 100 Lafayette Ct
- 309 Lenox Cir
- 311 Lenox Cir
- 307 Lenox Cir
- 103 Lafayette Ct
- 216 Lenox Cir
- 214 Lenox Cir
- 210 Lenox Cir
- 212 Lenox Cir
- 208 Lenox Cir
- 206 Lenox Cir
- 204 Lenox Cir
- 103 Lenox Cir
- 202 Lenox Cir
- 104 Lafayette Ct