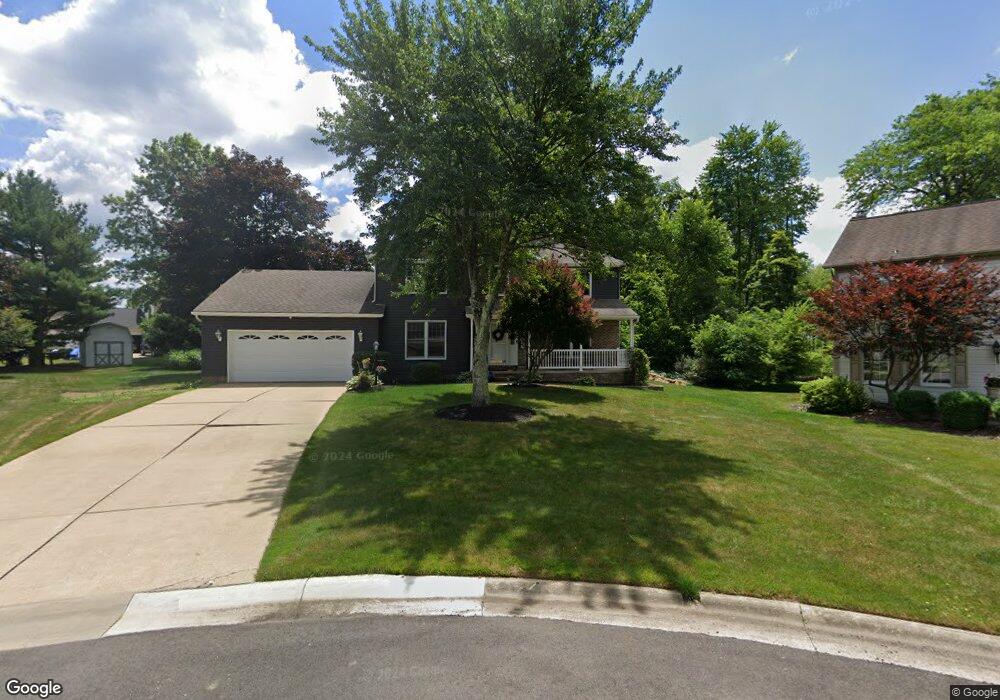
3170 Glastonbury Cir NW Canton, OH 44708
Estimated Value: $375,000 - $470,000
4
Beds
4
Baths
2,139
Sq Ft
$190/Sq Ft
Est. Value
About This Home
This home is located at 3170 Glastonbury Cir NW, Canton, OH 44708 and is currently estimated at $406,530, approximately $190 per square foot. 3170 Glastonbury Cir NW is a home located in Stark County with nearby schools including Lake Cable Elementary School, Jackson Memorial Middle School, and Jackson High School.
Ownership History
Date
Name
Owned For
Owner Type
Purchase Details
Closed on
Sep 13, 2011
Sold by
Morris Jason E and Morris Nancy M
Bought by
Gnau Kenneth L and Ruzinsky Angela
Current Estimated Value
Home Financials for this Owner
Home Financials are based on the most recent Mortgage that was taken out on this home.
Original Mortgage
$157,500
Outstanding Balance
$62,134
Interest Rate
4.32%
Mortgage Type
New Conventional
Estimated Equity
$344,396
Purchase Details
Closed on
Dec 18, 2007
Sold by
Fairless Jeffrey R and Fairless Lorri L
Bought by
Morris Jason E and Morris Nancy M
Home Financials for this Owner
Home Financials are based on the most recent Mortgage that was taken out on this home.
Original Mortgage
$204,000
Interest Rate
6.3%
Mortgage Type
Purchase Money Mortgage
Purchase Details
Closed on
Apr 30, 1991
Create a Home Valuation Report for This Property
The Home Valuation Report is an in-depth analysis detailing your home's value as well as a comparison with similar homes in the area
Home Values in the Area
Average Home Value in this Area
Purchase History
| Date | Buyer | Sale Price | Title Company |
|---|---|---|---|
| Gnau Kenneth L | $217,500 | None Available | |
| Morris Jason E | $215,500 | Attorney | |
| -- | $31,000 | -- |
Source: Public Records
Mortgage History
| Date | Status | Borrower | Loan Amount |
|---|---|---|---|
| Open | Gnau Kenneth L | $157,500 | |
| Previous Owner | Morris Jason E | $204,000 |
Source: Public Records
Tax History Compared to Growth
Tax History
| Year | Tax Paid | Tax Assessment Tax Assessment Total Assessment is a certain percentage of the fair market value that is determined by local assessors to be the total taxable value of land and additions on the property. | Land | Improvement |
|---|---|---|---|---|
| 2025 | -- | $123,420 | $28,180 | $95,240 |
| 2024 | -- | $123,420 | $28,180 | $95,240 |
| 2023 | $4,178 | $83,940 | $23,140 | $60,800 |
| 2022 | $4,157 | $83,940 | $23,140 | $60,800 |
| 2021 | $4,174 | $83,940 | $23,140 | $60,800 |
| 2020 | $3,971 | $73,400 | $19,950 | $53,450 |
| 2019 | $3,825 | $73,400 | $19,950 | $53,450 |
| 2018 | $3,844 | $73,400 | $19,950 | $53,450 |
| 2017 | $3,684 | $66,920 | $15,260 | $51,660 |
| 2016 | $3,708 | $66,920 | $15,260 | $51,660 |
| 2015 | $3,753 | $66,920 | $15,260 | $51,660 |
| 2014 | $1,757 | $64,060 | $14,600 | $49,460 |
| 2013 | $1,849 | $64,060 | $14,600 | $49,460 |
Source: Public Records
Map
Nearby Homes
- 3273 Dellwood Ave NW
- 5966 Hawks Nest Cir NW
- 3436 Cardiff Ave NW
- 5843 Hawks Nest Cir NW
- 5845 Hawks Nest Cir NW
- 3633 Barrington Place NW
- 5846 Hawks Nest Cir NW
- 2889 Vicksburg Ave NW
- 5848 Hawks Nest Cir NW
- 3490 Cardiff Ave NW
- 5851 Hawks Nest Cir NW
- 5853 Hawks Nest Cir NW
- 5867 Hawks Nest Cir NW
- 5869 Hawks Nest Cir NW
- 5877 Hawks Nest Cir NW
- 5879 Hawks Nest Cir NW
- 0 Bertram Ave NW Unit 5051955
- 6436 Hensley St NW
- 2942 Torrey Pines Cir NW
- 3591 Harris Ave NW
- 3171 Glastonbury Cir NW
- 3161 Modred Cir NW
- 3190 Glastonbury Cir NW
- 3141 Modred Cir NW
- 3181 Modred Cir NW
- 3210 Glastonbury Cir NW
- 3201 Modred Cir NW
- 3191 Glastonbury Cir NW
- 3140 Modred Cir NW
- 3230 Glastonbury Cir NW
- 3231 Glastonbury Cir NW
- 3225 Modred Cir NW
- 3160 Modred Cir NW
- 3180 Modred Cir NW
- 6314 Canterbury St NW
- 3200 Modred Cir NW
- 3060 Perry Dr NW
- 6332 Canterbury St NW
- 3224 Modred Cir NW
- 3255 Anglo Cir NW