3170 Potawatomie Trail Saugatuck, MI 49453
Estimated Value: $667,868 - $1,013,000
3
Beds
2
Baths
2,750
Sq Ft
$307/Sq Ft
Est. Value
About This Home
This home is located at 3170 Potawatomie Trail, Saugatuck, MI 49453 and is currently estimated at $845,217, approximately $307 per square foot. 3170 Potawatomie Trail is a home located in Allegan County with nearby schools including Hamilton High School.
Ownership History
Date
Name
Owned For
Owner Type
Purchase Details
Closed on
Apr 11, 2024
Sold by
Buys Theo B and Buys Annette A
Bought by
Buys Theo B and Buys Annette A
Current Estimated Value
Purchase Details
Closed on
Jan 18, 2010
Sold by
Wolff Steven G
Bought by
Buys Theo B and Buys Annette A
Home Financials for this Owner
Home Financials are based on the most recent Mortgage that was taken out on this home.
Original Mortgage
$200,000
Interest Rate
4.37%
Mortgage Type
New Conventional
Purchase Details
Closed on
Nov 9, 2004
Sold by
Skinner James Alan and Skinner Nickolee B
Bought by
Wolff Steven G
Home Financials for this Owner
Home Financials are based on the most recent Mortgage that was taken out on this home.
Original Mortgage
$245,200
Interest Rate
5.87%
Mortgage Type
Purchase Money Mortgage
Purchase Details
Closed on
Nov 20, 2003
Sold by
Skinner James Alan and Skinner Nickolee B
Bought by
Gmac Mortgage Corp
Create a Home Valuation Report for This Property
The Home Valuation Report is an in-depth analysis detailing your home's value as well as a comparison with similar homes in the area
Home Values in the Area
Average Home Value in this Area
Purchase History
| Date | Buyer | Sale Price | Title Company |
|---|---|---|---|
| Buys Theo B | -- | None Listed On Document | |
| Buys Theo B | $329,000 | Lighthouse Title Inc | |
| Wolff Steven G | $306,500 | Chicago Title | |
| Gmac Mortgage Corp | $265,983 | -- |
Source: Public Records
Mortgage History
| Date | Status | Borrower | Loan Amount |
|---|---|---|---|
| Previous Owner | Buys Theo B | $200,000 | |
| Previous Owner | Wolff Steven G | $245,200 |
Source: Public Records
Tax History Compared to Growth
Tax History
| Year | Tax Paid | Tax Assessment Tax Assessment Total Assessment is a certain percentage of the fair market value that is determined by local assessors to be the total taxable value of land and additions on the property. | Land | Improvement |
|---|---|---|---|---|
| 2025 | $5,719 | $346,300 | $67,400 | $278,900 |
| 2024 | -- | $311,600 | $41,600 | $270,000 |
| 2023 | $5,230 | $267,900 | $41,600 | $226,300 |
| 2022 | $5,059 | $237,700 | $34,900 | $202,800 |
| 2021 | $4,870 | $207,900 | $34,900 | $173,000 |
| 2020 | $4,497 | $186,500 | $34,900 | $151,600 |
| 2019 | $4,223 | $179,100 | $34,900 | $144,200 |
| 2018 | $4,223 | $167,100 | $34,900 | $132,200 |
| 2017 | $0 | $157,100 | $34,900 | $122,200 |
| 2016 | $0 | $148,700 | $28,500 | $120,200 |
| 2015 | -- | $148,700 | $28,500 | $120,200 |
| 2014 | -- | $149,000 | $28,500 | $120,500 |
| 2013 | -- | $149,300 | $28,500 | $120,800 |
Source: Public Records
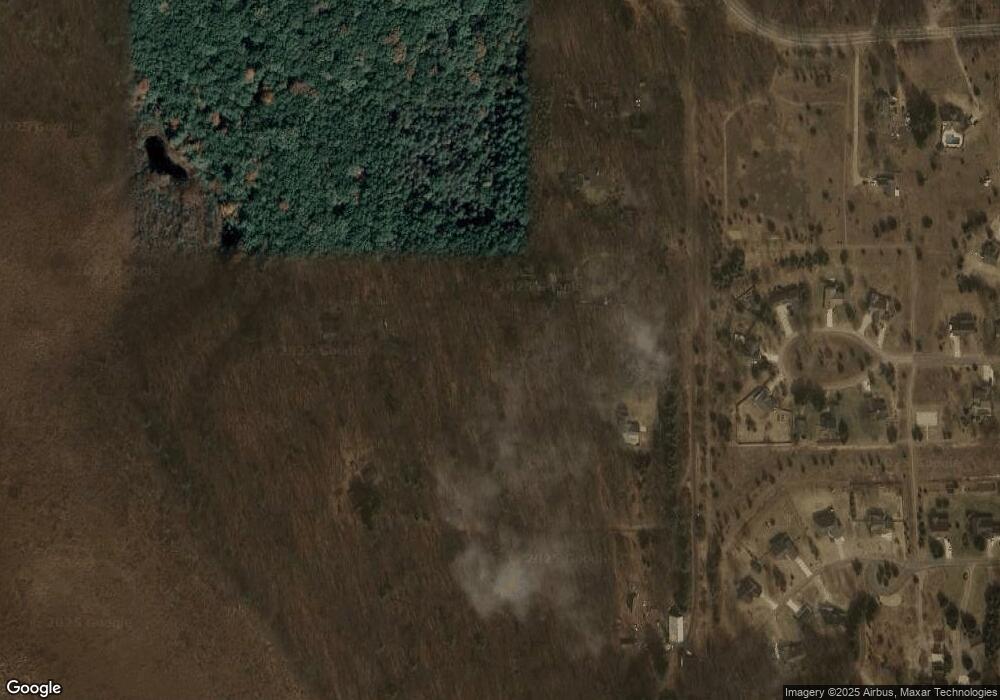
Map
Nearby Homes
- VL 60th St
- 6187 Bayou Trail
- 6242 131st St
- 3328 Pine Glen Dr Unit Lot H
- 5932 Wilderness Trail
- 6289 Gesh Trail
- 6312 Silver Lake Dr
- 6332 Old Allegan Rd
- 5916 Preservation Dr Unit 16
- 3192 Beach Trail Dr
- 6236 Arrowhead Dr Unit 31
- 6115 Masters Ln Unit 54
- 6309 Riverside Rd
- 3426 63rd St
- 6346 Riverside Rd
- 6358 134th Ave
- 6403 Riverside Rd
- 3139 57th St
- Lot Jack Wilson Rd
- 3131 57th St
- 3170 Potawatomie Trail
- 3158 Potawatomie Trail
- 3178 Potawatomie Trail
- 3186 Potawatomie Trail
- 3164 Potawatomie Trail
- 3164 Pottawatomie Trail
- 6026 Old Allegan Rd
- 6036 Pottawatomie Ridge Dr
- 6032 Pottawatomie Ridge Dr
- 6031 Pottawatomie Ridge Dr
- 6036 Old Allegan Rd
- 6036 Old Allegan Rd
- 6036 Old Allegan Rd
- 6029 River Ridge Dr Unit 11
- 6028 Old Allegan Rd
- 6038 Old Allegan Rd
- 6028 Pottawatomie Ridge Dr
- 6027 Pottawatomie Ridge Dr Unit 24
- 6025 River Ridge Dr Unit 12
- 6058 Old Allegan Rd