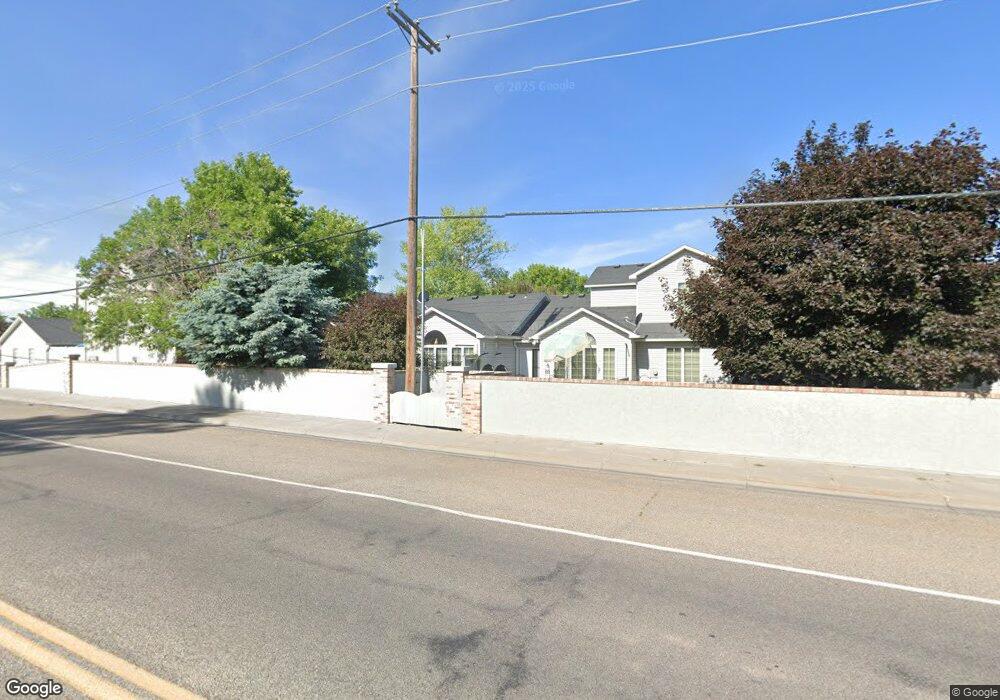
3170 Thayer Bridge Cir Idaho Falls, ID 83402
Estimated Value: $317,000 - $387,000
3
Beds
4
Baths
1,875
Sq Ft
$189/Sq Ft
Est. Value
About This Home
This home is located at 3170 Thayer Bridge Cir, Idaho Falls, ID 83402 and is currently estimated at $354,820, approximately $189 per square foot. 3170 Thayer Bridge Cir is a home located in Bonneville County with nearby schools including Longfellow Elementary School, Eagle Rock Middle School, and Skyline Senior High School.
Ownership History
Date
Name
Owned For
Owner Type
Purchase Details
Closed on
Dec 7, 2024
Sold by
Thayer Bridge Homeowners Association
Bought by
Thayer Bridge Homeowners Association Inc
Current Estimated Value
Purchase Details
Closed on
Feb 26, 2024
Sold by
Staker Travis Dean
Bought by
Strobel Austin and Strobel Caitlin Jnae
Purchase Details
Closed on
Jul 8, 2022
Sold by
Anne Meikle
Bought by
Gatlin Michael
Home Financials for this Owner
Home Financials are based on the most recent Mortgage that was taken out on this home.
Original Mortgage
$245,471
Interest Rate
5.1%
Mortgage Type
FHA
Purchase Details
Closed on
Jul 9, 2007
Sold by
Jardine Nanci E and Jardine T
Bought by
Meikle Anne
Home Financials for this Owner
Home Financials are based on the most recent Mortgage that was taken out on this home.
Original Mortgage
$102,000
Interest Rate
6.36%
Mortgage Type
New Conventional
Create a Home Valuation Report for This Property
The Home Valuation Report is an in-depth analysis detailing your home's value as well as a comparison with similar homes in the area
Home Values in the Area
Average Home Value in this Area
Purchase History
| Date | Buyer | Sale Price | Title Company |
|---|---|---|---|
| Thayer Bridge Homeowners Association Inc | -- | None Listed On Document | |
| Strobel Austin | -- | Pioneer Title | |
| Gatlin Michael | -- | Alliance Title | |
| Meikle Anne | -- | None Available |
Source: Public Records
Mortgage History
| Date | Status | Borrower | Loan Amount |
|---|---|---|---|
| Previous Owner | Gatlin Michael | $245,471 | |
| Previous Owner | Meikle Anne | $102,000 |
Source: Public Records
Tax History Compared to Growth
Tax History
| Year | Tax Paid | Tax Assessment Tax Assessment Total Assessment is a certain percentage of the fair market value that is determined by local assessors to be the total taxable value of land and additions on the property. | Land | Improvement |
|---|---|---|---|---|
| 2025 | $2,667 | $260,856 | $7,606 | $253,250 |
| 2024 | $2,667 | $288,584 | $12,829 | $275,755 |
| 2023 | $2,535 | $257,337 | $24,317 | $233,020 |
| 2022 | $3,066 | $244,444 | $22,304 | $222,140 |
| 2021 | $3,190 | $189,863 | $21,323 | $168,540 |
| 2019 | $1,628 | $172,208 | $20,038 | $152,170 |
| 2018 | $1,242 | $180,730 | $19,260 | $161,470 |
| 2017 | $1,146 | $129,972 | $13,582 | $116,390 |
| 2016 | $1,191 | $120,943 | $13,273 | $107,670 |
| 2015 | $1,134 | $119,351 | $13,273 | $106,078 |
| 2014 | $31,150 | $119,351 | $12,551 | $106,800 |
| 2013 | $1,060 | $114,801 | $12,551 | $102,250 |
Source: Public Records
Map
Nearby Homes
- 3074 Thayer Bridge Cir
- 3535 Sycamore Cir
- 597 Hickory Place
- 3490 E Elswood Dr
- 3635 Tuscany Dr
- 3518 E Elswood Dr
- 2829 Westmoreland Dr
- 585 Chesterfield Ln
- 2820 E Morningside Dr
- 3931 Nottingham Ln
- 3950 Tuscany Dr
- 2930 S Yellowstone Hwy
- 3930 Barossa Dr
- 3981 Cambria Dr
- 3984 Silverado Dr
- 3897 Nathan Dr
- 142 Stone Run Ln
- 4120 Silverado Dr
- 144 Brookside Dr
- 182 Hartert Dr
- 3168 Thayer Bridge Cir
- 3168 Thayer Bridge Cir Unit 14-G
- 3166 Thayer Bridge Cir
- 3164 Thayer Bridge Cir
- 3162 Thayer Bridge Cir
- 3160 Thayer Bridge Cir
- 3160 Thayer Bridge Cir Unit 10
- 3158 Thayer Bridge Cir
- 3154 Thayer Bridge Cir
- 3152 Thayer Bridge Cir
- 3178 Thayer Bridge Cir
- 3156 Thayer Bridge Cir
- 3174 Thayer Bridge Cir
- 3182 Thayer Bridge Cir
- 3148 Thayer Bridge Cir
- 3148 Thayer Bridge Cir Unit 5
- 3144 Thayer Bridge Cir
- 3186 Thayer Bridge Cir
- 3136 Thayer Bridge Cir
- 3082 Thayer Bridge Cir