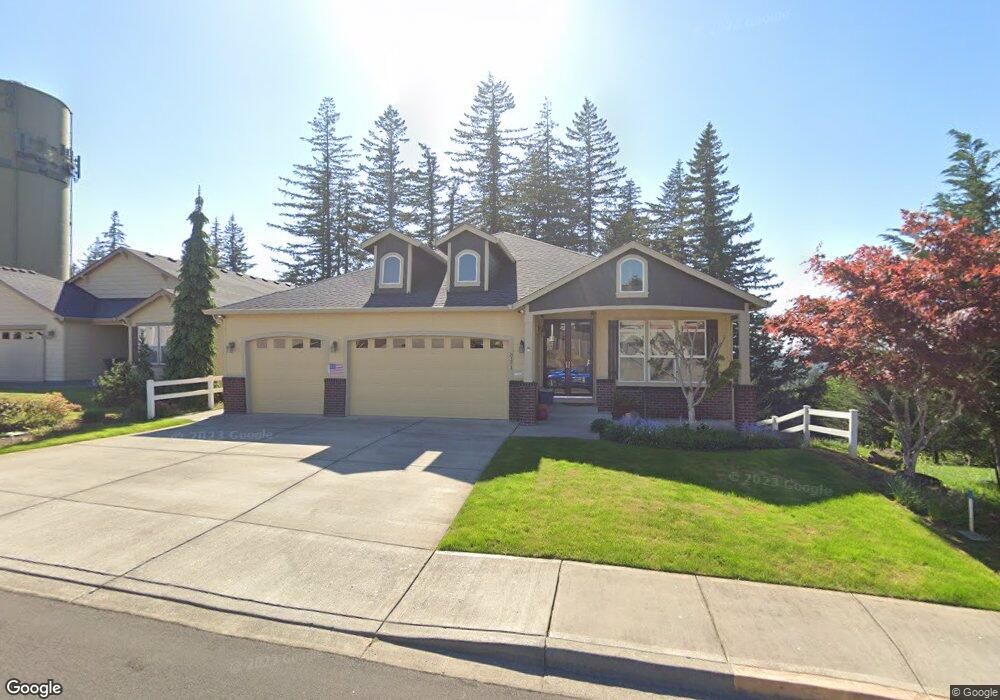
3171 44th St Washougal, WA 98671
Estimated Value: $659,000 - $746,000
3
Beds
2
Baths
2,142
Sq Ft
$322/Sq Ft
Est. Value
About This Home
This home is located at 3171 44th St, Washougal, WA 98671 and is currently estimated at $689,509, approximately $321 per square foot. 3171 44th St is a home located in Clark County with nearby schools including Gause Elementary School, Canyon Creek Middle School, and Washougal High School.
Ownership History
Date
Name
Owned For
Owner Type
Purchase Details
Closed on
Aug 18, 2015
Sold by
Rounds Cathy A and Lowers James M
Bought by
Cathy Rounds & James Lowers Revocable Tr
Current Estimated Value
Purchase Details
Closed on
Jun 24, 2009
Sold by
Manor Homes Llc
Bought by
Rounds Cathy A and Lowers James M
Home Financials for this Owner
Home Financials are based on the most recent Mortgage that was taken out on this home.
Original Mortgage
$228,750
Outstanding Balance
$144,994
Interest Rate
4.83%
Mortgage Type
Purchase Money Mortgage
Estimated Equity
$544,515
Purchase Details
Closed on
May 8, 2009
Sold by
The Teuscher Llc
Bought by
Manor Homes Llc
Home Financials for this Owner
Home Financials are based on the most recent Mortgage that was taken out on this home.
Original Mortgage
$228,750
Outstanding Balance
$144,994
Interest Rate
4.83%
Mortgage Type
Purchase Money Mortgage
Estimated Equity
$544,515
Create a Home Valuation Report for This Property
The Home Valuation Report is an in-depth analysis detailing your home's value as well as a comparison with similar homes in the area
Home Values in the Area
Average Home Value in this Area
Purchase History
| Date | Buyer | Sale Price | Title Company |
|---|---|---|---|
| Cathy Rounds & James Lowers Revocable Tr | -- | None Available | |
| Rounds Cathy A | $332,148 | Chicago Title Insurance | |
| Manor Homes Llc | $65,280 | Chicago Title Insurance |
Source: Public Records
Mortgage History
| Date | Status | Borrower | Loan Amount |
|---|---|---|---|
| Open | Rounds Cathy A | $228,750 | |
| Previous Owner | Manor Homes Llc | $225,000 |
Source: Public Records
Tax History Compared to Growth
Tax History
| Year | Tax Paid | Tax Assessment Tax Assessment Total Assessment is a certain percentage of the fair market value that is determined by local assessors to be the total taxable value of land and additions on the property. | Land | Improvement |
|---|---|---|---|---|
| 2025 | $5,784 | $615,703 | $120,000 | $495,703 |
| 2024 | $5,634 | $609,845 | $144,000 | $465,845 |
| 2023 | $5,456 | $621,816 | $154,800 | $467,016 |
| 2022 | $5,450 | $589,568 | $154,800 | $434,768 |
| 2021 | $5,281 | $511,073 | $132,000 | $379,073 |
| 2020 | $5,075 | $464,625 | $120,000 | $344,625 |
| 2019 | $4,393 | $453,565 | $120,000 | $333,565 |
| 2018 | $5,034 | $415,141 | $0 | $0 |
| 2017 | $3,965 | $392,615 | $0 | $0 |
| 2016 | $3,832 | $339,639 | $0 | $0 |
| 2015 | $3,699 | $300,204 | $0 | $0 |
| 2014 | -- | $288,284 | $0 | $0 |
| 2013 | -- | $246,090 | $0 | $0 |
Source: Public Records
Map
Nearby Homes