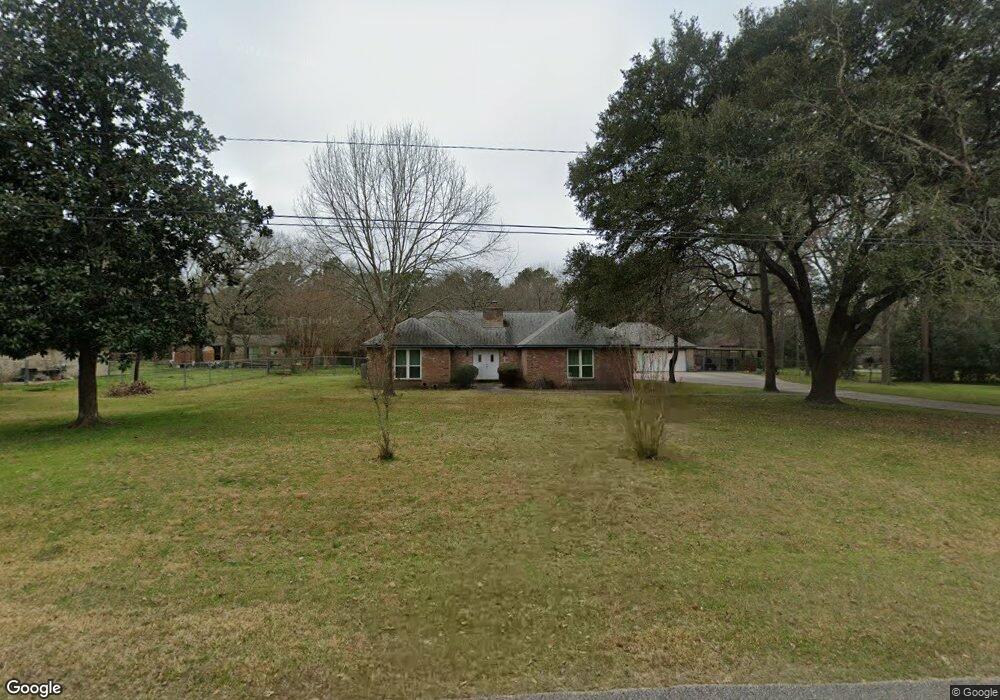
31711 Oak Crossing Magnolia, TX 77355
Estimated Value: $292,043 - $416,000
--
Bed
2
Baths
1,790
Sq Ft
$204/Sq Ft
Est. Value
About This Home
This home is located at 31711 Oak Crossing, Magnolia, TX 77355 and is currently estimated at $364,761, approximately $203 per square foot. 31711 Oak Crossing is a home located in Montgomery County with nearby schools including Magnolia Elementary School, Magnolia Sixth Grade Campus, and Magnolia Junior High School.
Ownership History
Date
Name
Owned For
Owner Type
Purchase Details
Closed on
Nov 20, 1990
Sold by
Adm Of Veterans Affairs
Bought by
Mackey Edward F and Mackey Linda A
Current Estimated Value
Purchase Details
Closed on
May 8, 1990
Sold by
Firemans Fund Mortg Corp
Bought by
Mackey Edward F and Mackey Linda A
Purchase Details
Closed on
Mar 6, 1990
Sold by
Fulton Fulton P and Fulton Marjorie
Bought by
Mackey Edward F and Mackey Linda A
Purchase Details
Closed on
Mar 30, 1981
Sold by
Ellis Jim Edward and Ellis Dorothy
Bought by
Fulton Prentiss G and Fulton Marjorie R
Home Financials for this Owner
Home Financials are based on the most recent Mortgage that was taken out on this home.
Original Mortgage
$69,400
Interest Rate
8.24%
Create a Home Valuation Report for This Property
The Home Valuation Report is an in-depth analysis detailing your home's value as well as a comparison with similar homes in the area
Home Values in the Area
Average Home Value in this Area
Purchase History
| Date | Buyer | Sale Price | Title Company |
|---|---|---|---|
| Mackey Edward F | -- | -- | |
| Mackey Edward F | -- | -- | |
| Mackey Edward F | -- | -- | |
| Fulton Prentiss G | -- | Houston Title | |
| Fulton Prentiss G | -- | -- |
Source: Public Records
Mortgage History
| Date | Status | Borrower | Loan Amount |
|---|---|---|---|
| Previous Owner | Fulton Prentiss G | $69,400 |
Source: Public Records
Tax History Compared to Growth
Tax History
| Year | Tax Paid | Tax Assessment Tax Assessment Total Assessment is a certain percentage of the fair market value that is determined by local assessors to be the total taxable value of land and additions on the property. | Land | Improvement |
|---|---|---|---|---|
| 2025 | -- | $257,043 | -- | -- |
| 2024 | $639 | $233,675 | -- | -- |
| 2023 | $639 | $212,430 | $37,100 | $266,090 |
| 2022 | $3,408 | $193,120 | $37,100 | $205,920 |
| 2021 | $3,263 | $175,560 | $37,100 | $138,460 |
| 2020 | $3,871 | $191,270 | $37,100 | $154,170 |
| 2019 | $3,587 | $178,130 | $37,100 | $162,090 |
| 2018 | $2,455 | $161,940 | $7,950 | $172,890 |
| 2017 | $3,122 | $147,220 | $7,950 | $182,060 |
| 2016 | $2,838 | $133,840 | $7,950 | $163,840 |
| 2015 | $1,729 | $121,670 | $7,950 | $145,620 |
| 2014 | $1,729 | $110,610 | $7,950 | $102,660 |
Source: Public Records
Map
Nearby Homes
- 38910 Fm 1774 Rd
- 31519 Brady St
- 30812 Willow Green Ln
- 278 Cumberland Forest Dr
- 21119 Aspen Adela Cove
- 21250 Natalia Grove
- 18618 N Sugar Maple Cir Unit 109
- 309 Cumberland Forest Dr
- 31315 Sugar Bend Dr
- 18523 Burch Creek Ln
- 28102 Nichols Sawmill Rd
- 118 Commerce St
- 0 Commerce
- 119 Magnolia Blvd
- 100 Sterling River Ln
- 309 Country Crossing Cir
- 110 Carriage Ct
- 332 Country Crossing Cir
- 201 Douglas Hills Dr
- 205 Douglas Hills Dr
- 31707 Oak Crossing
- 31715 Oak Crossing
- 31710 Cottonwood Ln
- 31706 Cottonwood Ln
- 31714 Cottonwood Ln
- 31710 Oak Crossing
- 32007 Oak Crossing
- 603 Creek Crossing
- 31819 Cottonwood Ln
- 31711 Cottonwood Ln
- 31715 Cottonwood Ln
- 31707 Cottonwood Ln
- 31803 Cottonwood Ln
- 31703 Cottonwood Ln
- 31707 Hickory Ct
- 31815 Oak Crossing
- 31710 Pine Crossing
- 31714 Pine Crossing
- 31810 Oak Crossing
- 31706 Pine Crossing