Estimated Value: $497,000 - $615,000
4
Beds
3
Baths
2,996
Sq Ft
$179/Sq Ft
Est. Value
About This Home
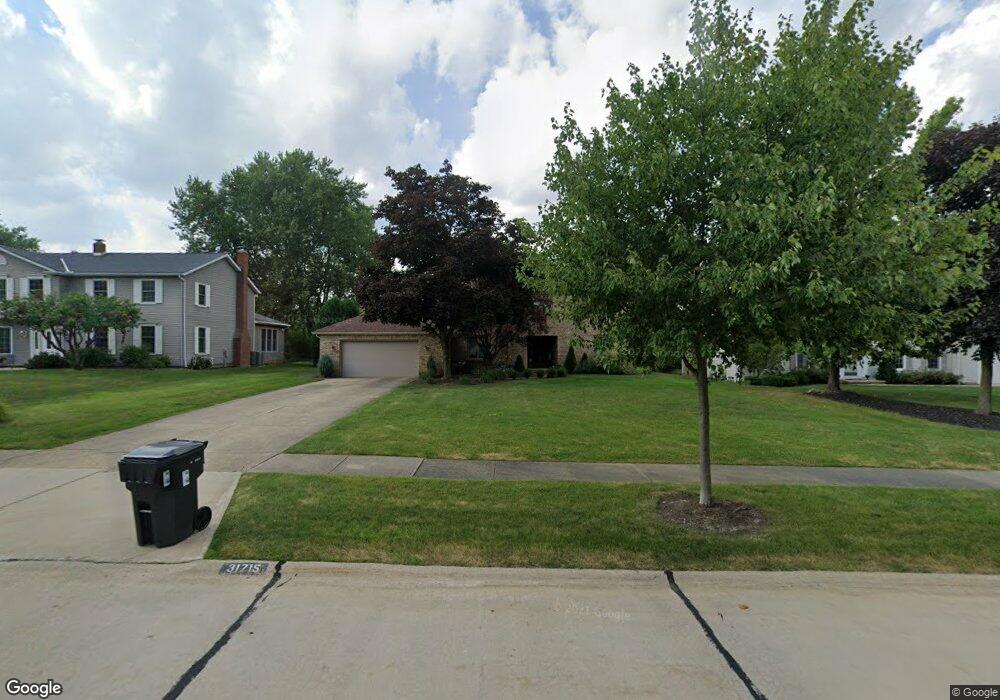
This home is located at 31715 Birch Cir, Solon, OH 44139 and is currently estimated at $535,544, approximately $178 per square foot. 31715 Birch Cir is a home located in Cuyahoga County with nearby schools including Dorothy E Lewis Elementary School, Orchard Middle School, and Solon Middle School.
Ownership History
Date
Name
Owned For
Owner Type
Purchase Details
Closed on
Aug 2, 2017
Sold by
Waxman Lisa J and Waxman David B
Bought by
Waxman David B and Waxman Lisa J
Current Estimated Value
Home Financials for this Owner
Home Financials are based on the most recent Mortgage that was taken out on this home.
Original Mortgage
$250,000
Outstanding Balance
$208,998
Interest Rate
4.03%
Mortgage Type
New Conventional
Estimated Equity
$326,546
Purchase Details
Closed on
Aug 7, 1999
Sold by
Stephen Liguzinski and Liguzinski Rita
Bought by
Waxman Lisa J
Home Financials for this Owner
Home Financials are based on the most recent Mortgage that was taken out on this home.
Original Mortgage
$220,000
Interest Rate
7.77%
Purchase Details
Closed on
Oct 14, 1980
Bought by
Liguzinski Stephen
Purchase Details
Closed on
May 23, 1980
Bought by
Ceko Construction Inc
Purchase Details
Closed on
Jan 1, 1978
Bought by
Eastern Electric Co Inc
Create a Home Valuation Report for This Property
The Home Valuation Report is an in-depth analysis detailing your home's value as well as a comparison with similar homes in the area
Home Values in the Area
Average Home Value in this Area
Purchase History
| Date | Buyer | Sale Price | Title Company |
|---|---|---|---|
| Waxman David B | -- | None Available | |
| Waxman Lisa J | $275,000 | Resource Title Agency Inc | |
| Liguzinski Stephen | $144,600 | -- | |
| Ceko Construction Inc | $28,900 | -- | |
| Eastern Electric Co Inc | -- | -- |
Source: Public Records
Mortgage History
| Date | Status | Borrower | Loan Amount |
|---|---|---|---|
| Open | Waxman David B | $250,000 | |
| Closed | Waxman Lisa J | $220,000 |
Source: Public Records
Tax History
| Year | Tax Paid | Tax Assessment Tax Assessment Total Assessment is a certain percentage of the fair market value that is determined by local assessors to be the total taxable value of land and additions on the property. | Land | Improvement |
|---|---|---|---|---|
| 2024 | $8,768 | $160,230 | $29,820 | $130,410 |
| 2023 | $8,787 | $131,330 | $29,160 | $102,170 |
| 2022 | $8,768 | $131,320 | $29,160 | $102,170 |
| 2021 | $8,668 | $131,320 | $29,160 | $102,170 |
| 2020 | $8,942 | $123,900 | $27,510 | $96,390 |
| 2019 | $8,660 | $354,000 | $78,600 | $275,400 |
| 2018 | $7,754 | $123,900 | $27,510 | $96,390 |
| 2017 | $7,567 | $114,320 | $25,170 | $89,150 |
| 2016 | $7,754 | $114,320 | $25,170 | $89,150 |
| 2015 | $7,196 | $114,320 | $25,170 | $89,150 |
| 2014 | $7,196 | $105,840 | $23,310 | $82,530 |
Source: Public Records
Map
Nearby Homes
- 30875 Cannon Rd
- 5560 Elm Hill Dr
- 30705 Cannon Rd
- 5496 Stone Creek
- 32957 Springside Ln
- 5151 Som Center Rd
- 5034 Medhurst Ave
- 5721 Som Center Rd Unit 25
- 5721 Som Center Rd Unit 18
- S/L 12 Neptune Oval
- S/L 1 Neptune Oval
- S/L 2 Neptune Oval
- S/L 11 Neptune Oval
- S/L 3 Neptune Oval
- S/L 13 Neptune Oval
- S/L 4 Neptune Oval
- 34040 Sherbrook Park Dr
- 5068 Neptune Oval
- 5076 Neptune Oval
- 5060 Neptune Oval
- 31655 Birch Cir
- 31775 Birch Cir
- 31595 Birch Cir
- 31710 Birch Cir
- 31770 Birch Cir
- 31535 Birch Cir
- 31590 Birch Cir
- 5425 Ridge Ln
- 5435 Ridge Ln
- 31475 Birch Cir
- 31530 Birch Cir
- 5460 Ridge Ln
- 5445 Ridge Ln
- 31470 Birch Cir Unit 1
- 5470 Ridge Ln
- 31375 Birch Cir
- 5455 Ridge Ln
- 5463 Pine Ln
- 5461 Pine Ln
- 31400 Birch Cir
Your Personal Tour Guide
Ask me questions while you tour the home.