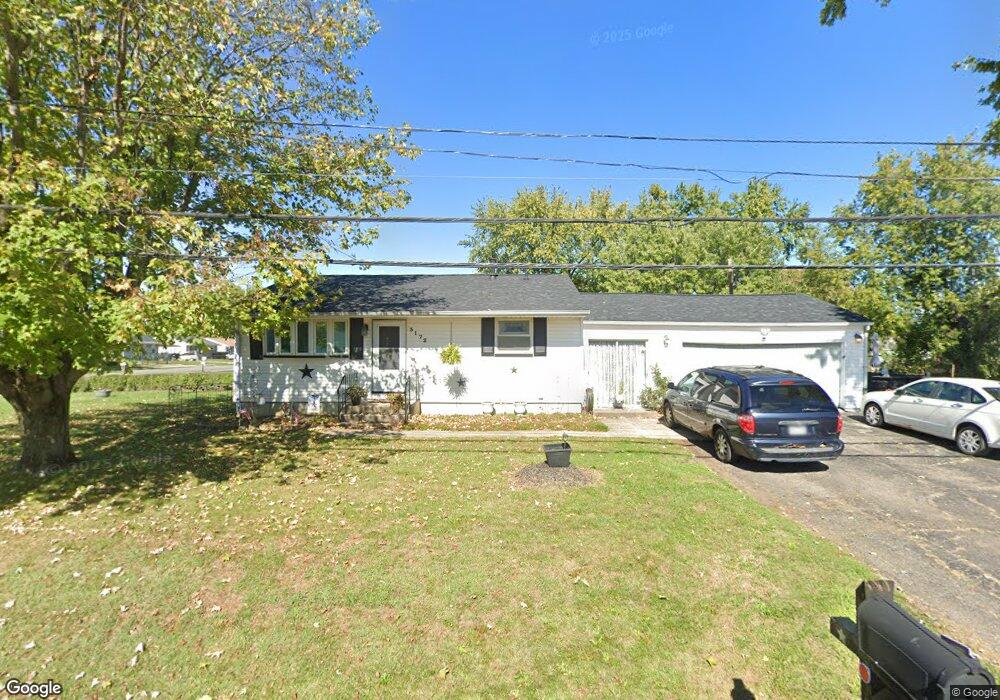
3172 Parsons Ave Columbus, OH 43207
Obetz-Lockbourne NeighborhoodEstimated Value: $197,000 - $224,000
3
Beds
1
Bath
1,100
Sq Ft
$190/Sq Ft
Est. Value
About This Home
This home is located at 3172 Parsons Ave, Columbus, OH 43207 and is currently estimated at $209,125, approximately $190 per square foot. 3172 Parsons Ave is a home located in Franklin County with nearby schools including Parsons Elementary School, Buckeye Middle School, and Marion-Franklin High School.
Ownership History
Date
Name
Owned For
Owner Type
Purchase Details
Closed on
Mar 30, 2018
Sold by
Cooper Rebecca L
Bought by
Cooper Kathy A
Current Estimated Value
Purchase Details
Closed on
Feb 27, 2018
Sold by
Copper Kenneth D and Copper Tiffany
Bought by
Cooper Kathy A
Purchase Details
Closed on
Mar 12, 1996
Sold by
Shirk Roger L
Bought by
Kenneth I Copper
Home Financials for this Owner
Home Financials are based on the most recent Mortgage that was taken out on this home.
Original Mortgage
$71,523
Interest Rate
7.05%
Mortgage Type
FHA
Purchase Details
Closed on
Jul 1, 1994
Sold by
Biliter Gary R
Bought by
Roger L Shirk
Home Financials for this Owner
Home Financials are based on the most recent Mortgage that was taken out on this home.
Original Mortgage
$62,600
Interest Rate
8.66%
Mortgage Type
New Conventional
Purchase Details
Closed on
Jun 1, 1985
Create a Home Valuation Report for This Property
The Home Valuation Report is an in-depth analysis detailing your home's value as well as a comparison with similar homes in the area
Home Values in the Area
Average Home Value in this Area
Purchase History
| Date | Buyer | Sale Price | Title Company |
|---|---|---|---|
| Cooper Kathy A | -- | None Available | |
| Cooper Kathy A | -- | None Available | |
| Kenneth I Copper | $71,900 | -- | |
| Roger L Shirk | $65,900 | -- | |
| -- | $48,000 | -- |
Source: Public Records
Mortgage History
| Date | Status | Borrower | Loan Amount |
|---|---|---|---|
| Previous Owner | Kenneth I Copper | $71,523 | |
| Previous Owner | Roger L Shirk | $62,600 |
Source: Public Records
Tax History Compared to Growth
Tax History
| Year | Tax Paid | Tax Assessment Tax Assessment Total Assessment is a certain percentage of the fair market value that is determined by local assessors to be the total taxable value of land and additions on the property. | Land | Improvement |
|---|---|---|---|---|
| 2024 | $3,511 | $78,230 | $18,660 | $59,570 |
| 2023 | $3,466 | $78,225 | $18,655 | $59,570 |
| 2022 | $1,993 | $38,430 | $11,410 | $27,020 |
| 2021 | $1,997 | $38,430 | $11,410 | $27,020 |
| 2020 | $2,199 | $38,430 | $11,410 | $27,020 |
| 2019 | $2,249 | $33,750 | $9,910 | $23,840 |
| 2018 | $1,879 | $33,750 | $9,910 | $23,840 |
| 2017 | $2,046 | $33,750 | $9,910 | $23,840 |
| 2016 | $1,890 | $28,530 | $5,570 | $22,960 |
| 2015 | $1,716 | $28,530 | $5,570 | $22,960 |
| 2014 | $1,720 | $28,530 | $5,570 | $22,960 |
| 2013 | $893 | $30,030 | $5,845 | $24,185 |
Source: Public Records
Map
Nearby Homes
- 3161 Lewis Rd
- 1633-1635 E Greenway Ave
- 228 Currier Dr
- 0 F Ave Unit 224036459
- 256 Rumsey Rd Unit 258
- 3380 Parsons Ave
- 400 Colton Rd
- 3414 Parsons Ave
- 2901 Parsons Ave
- 145 Ziegler Ave
- 202 Williams Rd
- 3302 Hilock Place
- 860 Basswood Rd
- 696 Williams Rd
- 164 E Alcott Rd
- 245 Marilla Rd
- 2808 Dolby Dr
- 525 Ashwood Rd
- 503 Ashwood Rd
- 0 Williams Rd
- 3166 Parsons Ave
- 3162 Parsons Ave
- 3176 Parsons Ave
- 1610 Parsons Ave
- 3158 Parsons Ave
- 3178 Parsons Ave
- 3175 Lewis Rd
- 3169 Lewis Rd
- 3165 Lewis Rd
- 3152 Parsons Ave
- 3179 Lewis Rd
- 3165 Parsons Ave
- 3180 Parsons Ave
- 3161 Parsons Ave
- 3155 Parsons Ave
- 3146 Parsons Ave
- 3157 Lewis Rd
- 3151 Parsons Ave
- 3199 Lewis Rd
- 3140 Parsons Ave