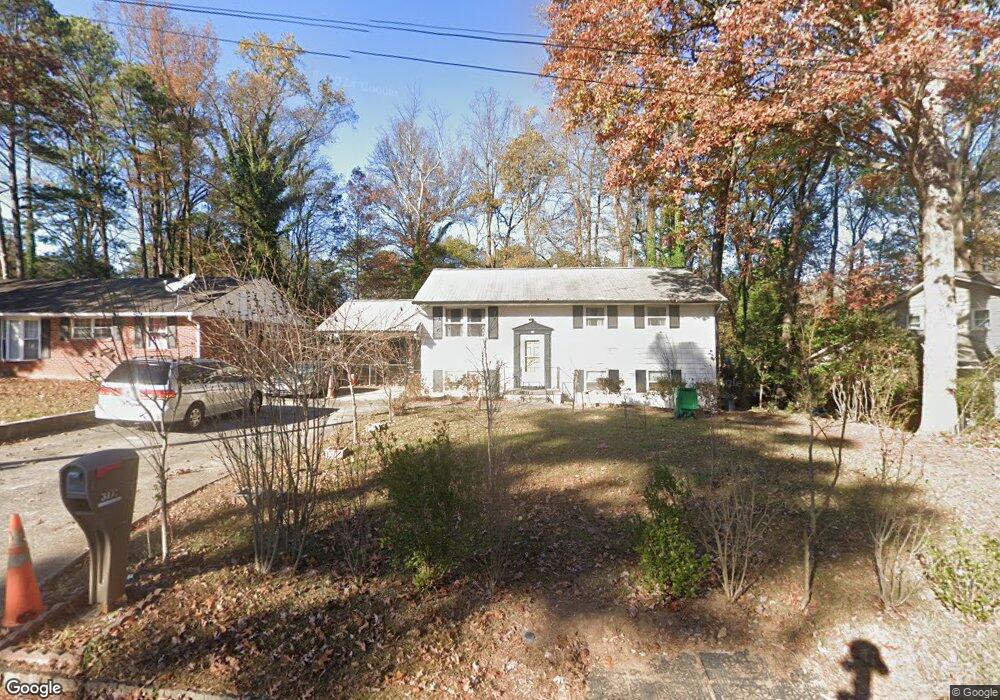
3172 Willow Oak Way Atlanta, GA 30340
Estimated Value: $288,000 - $363,000
3
Beds
1
Bath
988
Sq Ft
$322/Sq Ft
Est. Value
About This Home
This home is located at 3172 Willow Oak Way, Atlanta, GA 30340 and is currently estimated at $318,313, approximately $322 per square foot. 3172 Willow Oak Way is a home located in DeKalb County with nearby schools including Cary Reynolds Elementary School, Sequoyah Middle School, and Cross Keys High School.
Ownership History
Date
Name
Owned For
Owner Type
Purchase Details
Closed on
Dec 12, 2019
Sold by
Khalil Ibrahim
Bought by
Khalil Ibrahim and Begum Rahima
Current Estimated Value
Home Financials for this Owner
Home Financials are based on the most recent Mortgage that was taken out on this home.
Original Mortgage
$75,000
Outstanding Balance
$50,642
Interest Rate
3.7%
Mortgage Type
New Conventional
Estimated Equity
$267,671
Purchase Details
Closed on
Oct 30, 2014
Sold by
Toro Properties Rehab Llc
Bought by
Khalil Ibrahim
Home Financials for this Owner
Home Financials are based on the most recent Mortgage that was taken out on this home.
Original Mortgage
$99,920
Interest Rate
4.26%
Mortgage Type
New Conventional
Purchase Details
Closed on
Jul 24, 2014
Sold by
Casey John
Bought by
Toro Properties Rehab Llc
Purchase Details
Closed on
Dec 1, 2011
Sold by
Casey Dimple B
Bought by
Casey John J
Purchase Details
Closed on
Jun 28, 2011
Sold by
Casey John
Bought by
Casey Dimple B
Create a Home Valuation Report for This Property
The Home Valuation Report is an in-depth analysis detailing your home's value as well as a comparison with similar homes in the area
Home Values in the Area
Average Home Value in this Area
Purchase History
| Date | Buyer | Sale Price | Title Company |
|---|---|---|---|
| Khalil Ibrahim | -- | -- | |
| Khalil Ibrahim | $124,900 | -- | |
| Toro Properties Rehab Llc | $85,000 | -- | |
| Casey John J | $86,000 | -- | |
| Casey Dimple B | -- | -- |
Source: Public Records
Mortgage History
| Date | Status | Borrower | Loan Amount |
|---|---|---|---|
| Open | Khalil Ibrahim | $75,000 | |
| Previous Owner | Khalil Ibrahim | $99,920 |
Source: Public Records
Tax History Compared to Growth
Tax History
| Year | Tax Paid | Tax Assessment Tax Assessment Total Assessment is a certain percentage of the fair market value that is determined by local assessors to be the total taxable value of land and additions on the property. | Land | Improvement |
|---|---|---|---|---|
| 2025 | $3,083 | $100,760 | $26,000 | $74,760 |
| 2024 | $2,772 | $109,760 | $26,000 | $83,760 |
| 2023 | $2,772 | $101,040 | $26,000 | $75,040 |
| 2022 | $1,865 | $74,120 | $26,000 | $48,120 |
| 2021 | $1,871 | $74,360 | $26,000 | $48,360 |
| 2020 | $1,857 | $73,560 | $26,000 | $47,560 |
| 2019 | $1,455 | $56,320 | $26,000 | $30,320 |
| 2018 | $1,317 | $51,880 | $26,000 | $25,880 |
| 2017 | $1,231 | $45,840 | $12,800 | $33,040 |
| 2016 | $1,245 | $46,920 | $12,800 | $34,120 |
| 2014 | $440 | $21,040 | $12,800 | $8,240 |
Source: Public Records
Map
Nearby Homes
- 3095 Revere Ct
- 3346 Oakcliff Rd
- 3752 Jamestown Ct
- 3946 Green Oak Dr
- 3823 Oxford Cir
- 4001 Red Oak Dr
- 3268 Oakcliff Rd
- 3790 Oxford Cir
- 2985 Ashlyn Creek Ct Unit 78
- 3276 Pin Oak Cir
- 2986 Ashlyn Pointe Dr
- 2991 N Dekalb Dr
- 2975 Ashlyn Crest Ct Unit 75
- 2956 N Dekalb Dr Unit D
- 2956 N Dekalb Dr Unit C
- 3317 Shady Oak Dr
- 2932 Ashlyn Pointe Dr
- 2952 N Dekalb Dr Unit C
- 3166 Willow Oak Way
- 3178 Willow Oak Way
- 3160 Willow Oak Way Unit 1
- 3173 Pin Oak Way
- 3173 Pin Oak Way Unit 6
- 3184 Willow Oak Way
- 3167 Pin Oak Way Unit 1
- 3179 Pin Oak Way
- 3161 Pin Oak Way Unit 1
- 3154 Willow Oak Way Unit 1
- 3185 Pin Oak Way Unit 1
- 3190 Willow Oak Way Unit 1
- 3155 Pin Oak Way
- 3191 Pin Oak Way Unit 1
- 3148 Willow Oak Way Unit 1
- 3469 Pin Oak Cir Unit 1
- 3149 Pin Oak Way
- 3845 Water Oak Way
- 3182 Pin Oak Way
- 3158 Pin Oak Way Unit 1