Estimated Value: $395,782 - $443,000
3
Beds
2
Baths
1,470
Sq Ft
$284/Sq Ft
Est. Value
About This Home
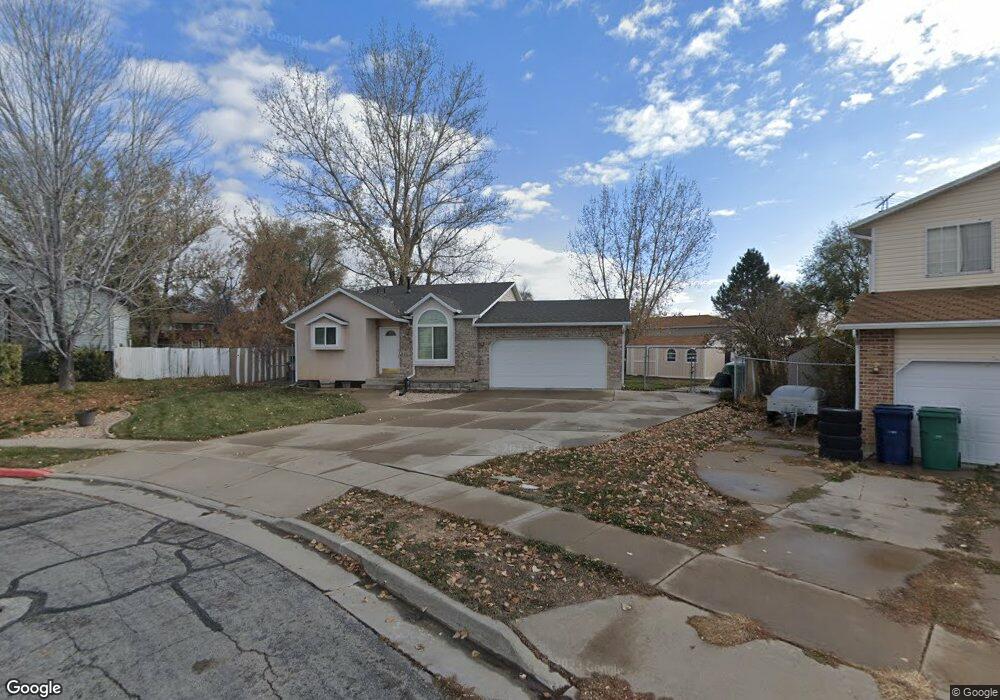
This home is located at 3173 W 5925 S, Roy, UT 84067 and is currently estimated at $418,196, approximately $284 per square foot. 3173 W 5925 S is a home located in Weber County with nearby schools including Roy Elementary School, Roy Junior High School, and Roy High School.
Ownership History
Date
Name
Owned For
Owner Type
Purchase Details
Closed on
Oct 27, 2008
Sold by
Wilson Chris C and Wilson Christine L
Bought by
Wilson Chris C
Current Estimated Value
Purchase Details
Closed on
May 15, 2006
Sold by
Wilson Cody K and Wilson Kilee A
Bought by
Wilson Chris C
Home Financials for this Owner
Home Financials are based on the most recent Mortgage that was taken out on this home.
Original Mortgage
$145,000
Outstanding Balance
$84,026
Interest Rate
6.41%
Mortgage Type
Fannie Mae Freddie Mac
Estimated Equity
$334,170
Purchase Details
Closed on
Sep 24, 2004
Sold by
Hess Karen C
Bought by
Wilson Cody K
Home Financials for this Owner
Home Financials are based on the most recent Mortgage that was taken out on this home.
Original Mortgage
$108,000
Interest Rate
5.8%
Mortgage Type
Balloon
Purchase Details
Closed on
Aug 11, 2003
Sold by
Yamasaki Randy Y
Bought by
Yamasaki Randy Y
Home Financials for this Owner
Home Financials are based on the most recent Mortgage that was taken out on this home.
Original Mortgage
$79,300
Interest Rate
5.17%
Mortgage Type
Purchase Money Mortgage
Create a Home Valuation Report for This Property
The Home Valuation Report is an in-depth analysis detailing your home's value as well as a comparison with similar homes in the area
Home Values in the Area
Average Home Value in this Area
Purchase History
| Date | Buyer | Sale Price | Title Company |
|---|---|---|---|
| Wilson Chris C | -- | None Available | |
| Wilson Chris C | -- | Bonneville Superior Title Co | |
| Wilson Cody K | -- | Heritage West | |
| Yamasaki Randy Y | -- | Us Title |
Source: Public Records
Mortgage History
| Date | Status | Borrower | Loan Amount |
|---|---|---|---|
| Open | Wilson Chris C | $145,000 | |
| Previous Owner | Wilson Cody K | $108,000 | |
| Previous Owner | Yamasaki Randy Y | $79,300 | |
| Closed | Wilson Cody K | $20,200 |
Source: Public Records
Tax History Compared to Growth
Tax History
| Year | Tax Paid | Tax Assessment Tax Assessment Total Assessment is a certain percentage of the fair market value that is determined by local assessors to be the total taxable value of land and additions on the property. | Land | Improvement |
|---|---|---|---|---|
| 2025 | $2,310 | $360,767 | $130,000 | $230,767 |
| 2024 | $2,257 | $195,249 | $71,423 | $123,826 |
| 2023 | $2,419 | $212,300 | $71,424 | $140,876 |
| 2022 | $2,528 | $229,350 | $60,503 | $168,847 |
| 2021 | $2,034 | $302,000 | $84,997 | $217,003 |
| 2020 | $1,881 | $256,000 | $84,997 | $171,003 |
| 2019 | $1,806 | $231,000 | $49,948 | $181,052 |
| 2018 | $1,699 | $204,000 | $46,959 | $157,041 |
| 2017 | $1,525 | $170,000 | $46,015 | $123,985 |
| 2016 | $1,499 | $90,062 | $24,389 | $65,673 |
| 2015 | $1,349 | $81,978 | $21,700 | $60,278 |
| 2014 | $1,257 | $75,125 | $21,700 | $53,425 |
Source: Public Records
Map
Nearby Homes