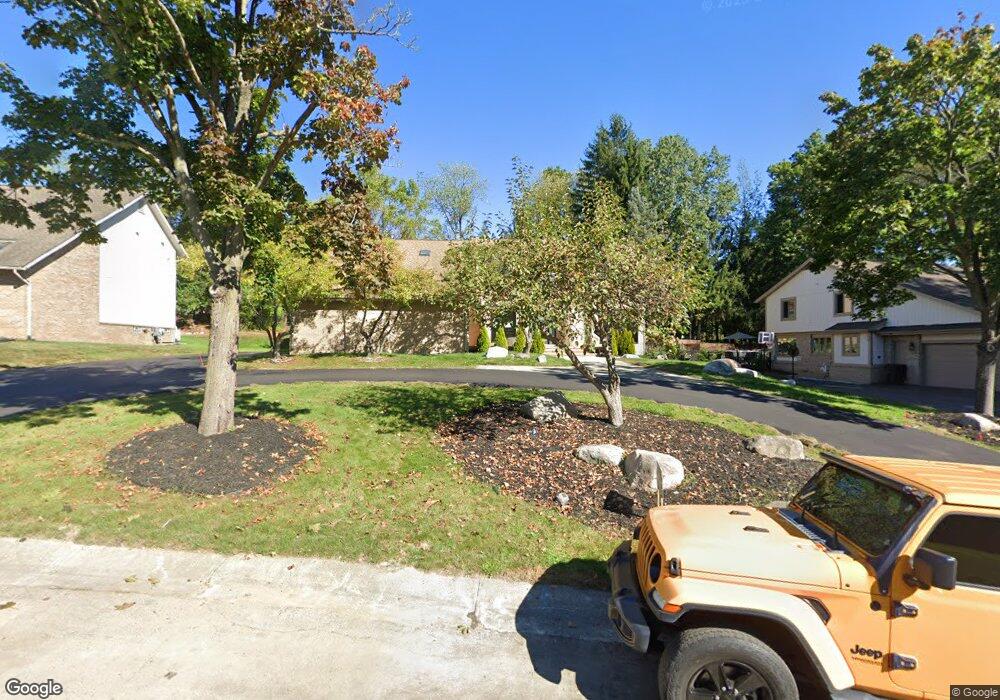
3176 Chambord Dr Unit Bldg-Unit West Bloomfield, MI 48323
Estimated Value: $690,743 - $705,000
4
Beds
6
Baths
3,396
Sq Ft
$205/Sq Ft
Est. Value
About This Home
This home is located at 3176 Chambord Dr Unit Bldg-Unit, West Bloomfield, MI 48323 and is currently estimated at $697,686, approximately $205 per square foot. 3176 Chambord Dr Unit Bldg-Unit is a home located in Oakland County with nearby schools including West Hills Middle School, Bloomfield Hills High School, and Brookfield Academy - West Bloomfield Campus.
Ownership History
Date
Name
Owned For
Owner Type
Purchase Details
Closed on
Mar 25, 2022
Sold by
Rochlani Bony
Bought by
Liaquat Shuwaib B and Chowdhury Nishat I
Current Estimated Value
Home Financials for this Owner
Home Financials are based on the most recent Mortgage that was taken out on this home.
Original Mortgage
$540,000
Outstanding Balance
$504,363
Interest Rate
3.89%
Mortgage Type
New Conventional
Estimated Equity
$193,323
Purchase Details
Closed on
May 6, 2004
Sold by
Gursky Bruce A and Bursky Beth A
Bought by
Rochlani Manjit and Rochlani Bony
Create a Home Valuation Report for This Property
The Home Valuation Report is an in-depth analysis detailing your home's value as well as a comparison with similar homes in the area
Home Values in the Area
Average Home Value in this Area
Purchase History
| Date | Buyer | Sale Price | Title Company |
|---|---|---|---|
| Liaquat Shuwaib B | $600,000 | Title One | |
| Liaquat Shuwaib B | $600,000 | Title One | |
| Rochlani Manjit | $542,500 | Title Source Inc |
Source: Public Records
Mortgage History
| Date | Status | Borrower | Loan Amount |
|---|---|---|---|
| Open | Liaquat Shuwaib B | $540,000 |
Source: Public Records
Tax History Compared to Growth
Tax History
| Year | Tax Paid | Tax Assessment Tax Assessment Total Assessment is a certain percentage of the fair market value that is determined by local assessors to be the total taxable value of land and additions on the property. | Land | Improvement |
|---|---|---|---|---|
| 2024 | $5,329 | $289,740 | $0 | $0 |
| 2022 | $5,157 | $268,400 | $25,000 | $243,400 |
| 2021 | $11,730 | $245,820 | $0 | $0 |
| 2020 | $3,997 | $247,360 | $25,000 | $222,360 |
| 2018 | $7,747 | $225,250 | $22,000 | $203,250 |
| 2015 | -- | $203,870 | $0 | $0 |
| 2014 | -- | $189,410 | $0 | $0 |
| 2011 | -- | $182,490 | $0 | $0 |
Source: Public Records
Map
Nearby Homes
- 3075 Bloomfield Park Dr
- 4941 Fairway Ridge Cir
- 3142 Bloomfield Shore Dr
- 4670 Cove Rd
- 4710 Cove Rd
- 4641 Cove Rd
- 3367 Lone Pine Rd
- 4568 Rolling Ridge Rd
- 3440 Lone Pine Rd
- 2460 Turner St
- 4274 Wendell Rd
- 5321 Fairway Ln Unit 7
- 5415 Fairway Ln
- 4427 Westover Dr
- 4435 Westover Dr
- 3845 Lone Pine Rd Unit 101
- 4724 Tara Ct
- 0 Wendell Rd Unit 20250033815
- 2433 Wickfield Rd
- 3835 Lone Pine Rd
- 3176 Chambord Dr
- 3184 Chambord Dr
- 3237 Bloomfield Park Dr
- 3168 Chambord Dr
- 3245 Bloomfield Park Dr
- 3179 Chambord Dr
- 3229 Bloomfield Park Dr
- 3160 Chambord Dr
- 3202 Chambord Dr
- 3253 Bloomfield Park Dr
- 3167 Chambord Dr
- 3225 Montmarte Cir
- 3221 Bloomfield Park Dr
- 3335 Montmarte Cir
- 3210 Chambord Dr
- 3211 Bloomfield Park Dr
- 3216 Woodview Lake Rd
- 3237 Montmarte Cir
- 3218 Montmarte Cir
- 3226 Montmarte Cir