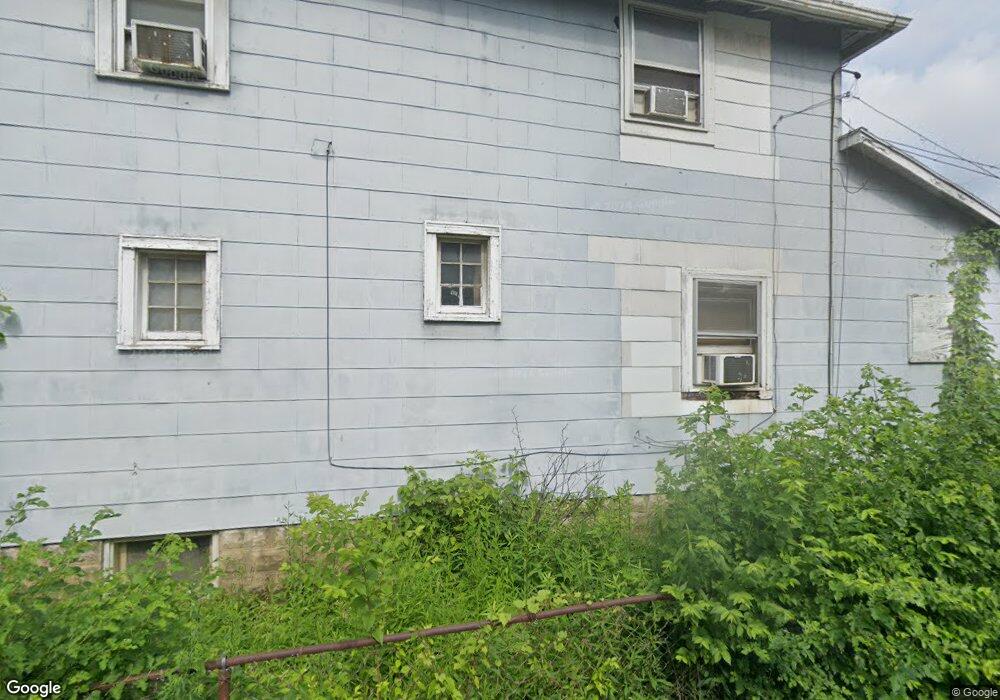
3176 E 5th Ave Columbus, OH 43219
Estimated Value: $181,000 - $229,923
4
Beds
2
Baths
1,960
Sq Ft
$108/Sq Ft
Est. Value
About This Home
This home is located at 3176 E 5th Ave, Columbus, OH 43219 and is currently estimated at $211,981, approximately $108 per square foot. 3176 E 5th Ave is a home located in Franklin County with nearby schools including East Columbus Elementary School, Champion Middle School, and East High School.
Ownership History
Date
Name
Owned For
Owner Type
Purchase Details
Closed on
Nov 21, 2023
Sold by
Economic Properties Llc
Bought by
Henson James
Current Estimated Value
Purchase Details
Closed on
Feb 4, 2022
Sold by
Florida Carolyn & Glenn
Bought by
Economic Properties Llc
Home Financials for this Owner
Home Financials are based on the most recent Mortgage that was taken out on this home.
Original Mortgage
$138,400
Interest Rate
3.56%
Mortgage Type
New Conventional
Purchase Details
Closed on
Jan 14, 2020
Sold by
Beehler Timothy A
Bought by
Florida Carolyn and Jones Glenn
Purchase Details
Closed on
Feb 5, 2015
Sold by
Logan Kelly M and Logan Adam
Bought by
Beehler Timothy A
Purchase Details
Closed on
Dec 17, 2012
Sold by
Monaghan Stephan L and Monaghan Phyllis M
Bought by
Logan Kelly M and Henderson Kimberly M
Purchase Details
Closed on
Apr 1, 1991
Bought by
Monaghan Stephan L
Create a Home Valuation Report for This Property
The Home Valuation Report is an in-depth analysis detailing your home's value as well as a comparison with similar homes in the area
Home Values in the Area
Average Home Value in this Area
Purchase History
| Date | Buyer | Sale Price | Title Company |
|---|---|---|---|
| Henson James | -- | None Listed On Document | |
| Economic Properties Llc | $173,000 | Landsel Title Agency | |
| Florida Carolyn | $15,000 | Golden Title Box | |
| Beehler Timothy A | $11,900 | None Available | |
| Logan Kelly M | -- | None Available | |
| Monaghan Stephan L | -- | -- |
Source: Public Records
Mortgage History
| Date | Status | Borrower | Loan Amount |
|---|---|---|---|
| Previous Owner | Economic Properties Llc | $138,400 |
Source: Public Records
Tax History
| Year | Tax Paid | Tax Assessment Tax Assessment Total Assessment is a certain percentage of the fair market value that is determined by local assessors to be the total taxable value of land and additions on the property. | Land | Improvement |
|---|---|---|---|---|
| 2025 | $4,922 | $70,770 | $10,010 | $60,760 |
| 2024 | $4,922 | $70,770 | $10,010 | $60,760 |
| 2023 | $3,353 | $70,770 | $10,010 | $60,760 |
| 2022 | $980 | $18,450 | $2,240 | $16,210 |
| 2021 | $982 | $18,450 | $2,240 | $16,210 |
| 2020 | $984 | $18,450 | $2,240 | $16,210 |
| 2019 | $1,267 | $16,770 | $2,030 | $14,740 |
| 2018 | $1,064 | $16,770 | $2,030 | $14,740 |
| 2017 | $1,086 | $16,770 | $2,030 | $14,740 |
| 2016 | $1,080 | $15,160 | $2,380 | $12,780 |
| 2015 | $938 | $15,160 | $2,380 | $12,780 |
| 2014 | $940 | $15,160 | $2,380 | $12,780 |
| 2013 | $545 | $17,815 | $2,800 | $15,015 |
Source: Public Records
Map
Nearby Homes
- 00 E 7th Ave
- 755 Stelzer Rd Unit 54
- 3014 E 7th Ave
- 0 E 7th Ave Unit Lot 79 225013171
- 0 E 7th Ave Unit Lot 77 225013170
- 0 E 7th Ave Unit Lot 78 225013168
- 2974 E 7th Ave
- 3237 E 12th Ave
- 0 E 5th Ave Unit 226008473
- 3123 E 13th Ave
- 2969 E 11th Ave
- 2827 E 6th Ave
- 3001 E 12th Ave
- 2798 E 5th Ave
- 2864 E 10th Ave
- 2841 E 10th Ave
- 261 Lowell Rd
- 243 N James Rd
- 253 N James Rd
- 177 N James Rd
- 3172-3176-3176 E 5th Ave
- 3172-3176-3176 E 5th Ave
- 3172 E 5th Ave Unit 176
- 3182 E 5th Ave
- 3168 E 5th Ave
- 3162 E 5th Ave
- 3156 E 5th Ave
- 3200 E 5th Ave
- 3179 E 6th Ave
- 3173 E 6th Ave
- 3152 E 5th Ave
- 3187 E 5th Ave
- 3179 E 5th Ave
- 3167 E 6th Ave
- 3193 E 6th Ave
- 3144 E 5th Ave
- 3163 E 6th Ave
- 3201 E 6th Ave
- 3195 E 5th Ave
- 3205 E 6th Ave
Your Personal Tour Guide
Ask me questions while you tour the home.