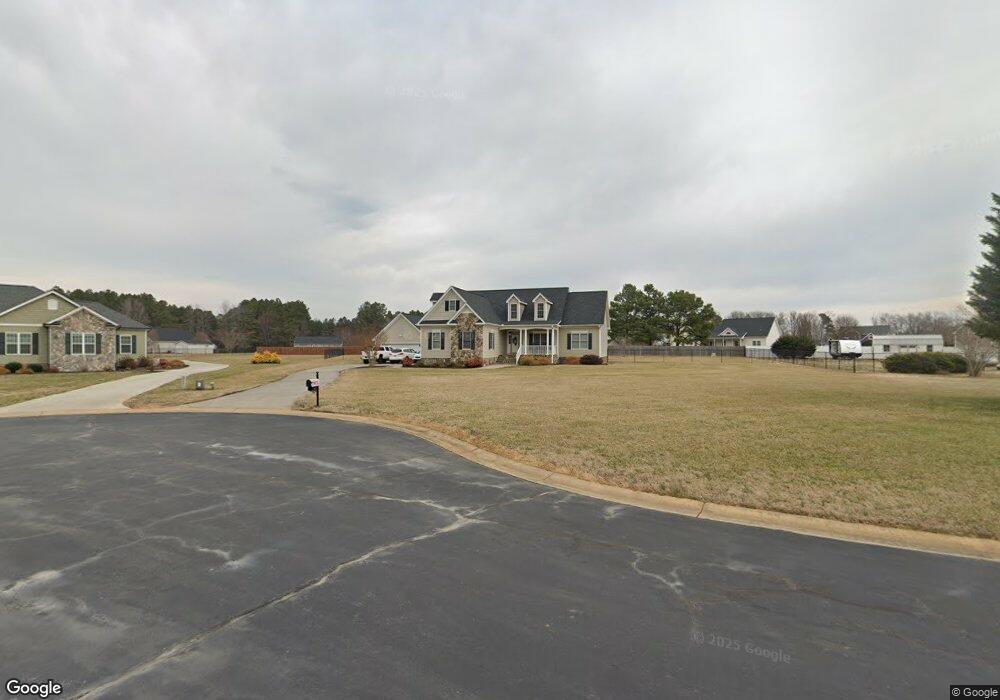
3178 Keller Ln Oxford, NC 27565
Estimated Value: $405,599 - $532,000
3
Beds
2
Baths
2,037
Sq Ft
$228/Sq Ft
Est. Value
About This Home
This home is located at 3178 Keller Ln, Oxford, NC 27565 and is currently estimated at $463,900, approximately $227 per square foot. 3178 Keller Ln is a home located in Granville County with nearby schools including West Oxford Elementary School, Northern Granville Middle School, and J.F. Webb High School.
Ownership History
Date
Name
Owned For
Owner Type
Purchase Details
Closed on
Apr 8, 2013
Sold by
Hamm Johnny H and Hamm Kathie Wade
Bought by
Pixler Allen A and Pixler Robin P
Current Estimated Value
Home Financials for this Owner
Home Financials are based on the most recent Mortgage that was taken out on this home.
Original Mortgage
$212,657
Outstanding Balance
$150,785
Interest Rate
3.57%
Mortgage Type
FHA
Estimated Equity
$313,115
Purchase Details
Closed on
Oct 19, 2011
Sold by
Hamm Johnny H
Bought by
Hamm Johnny H and Hamm Kathir Wade
Purchase Details
Closed on
Jul 30, 2007
Sold by
Ebbc Investments Llc
Bought by
Pittard John E and Jed Pittard Builders
Home Financials for this Owner
Home Financials are based on the most recent Mortgage that was taken out on this home.
Original Mortgage
$203,250
Interest Rate
6.65%
Mortgage Type
Construction
Create a Home Valuation Report for This Property
The Home Valuation Report is an in-depth analysis detailing your home's value as well as a comparison with similar homes in the area
Home Values in the Area
Average Home Value in this Area
Purchase History
| Date | Buyer | Sale Price | Title Company |
|---|---|---|---|
| Pixler Allen A | $220,000 | None Available | |
| Hamm Johnny H | -- | None Available | |
| Pittard John E | $25,000 | -- |
Source: Public Records
Mortgage History
| Date | Status | Borrower | Loan Amount |
|---|---|---|---|
| Open | Pixler Allen A | $212,657 | |
| Previous Owner | Pittard John E | $203,250 |
Source: Public Records
Tax History Compared to Growth
Tax History
| Year | Tax Paid | Tax Assessment Tax Assessment Total Assessment is a certain percentage of the fair market value that is determined by local assessors to be the total taxable value of land and additions on the property. | Land | Improvement |
|---|---|---|---|---|
| 2025 | $2,612 | $375,165 | $40,000 | $335,165 |
| 2024 | $2,612 | $375,165 | $40,000 | $335,165 |
| 2023 | $2,609 | $250,816 | $32,500 | $218,316 |
| 2022 | $2,288 | $250,816 | $32,500 | $218,316 |
| 2021 | $2,133 | $250,816 | $32,500 | $218,316 |
| 2020 | $2,133 | $250,816 | $32,500 | $218,316 |
| 2019 | $2,133 | $250,816 | $32,500 | $218,316 |
| 2018 | $2,133 | $250,816 | $32,500 | $218,316 |
| 2016 | $1,968 | $220,693 | $32,500 | $188,193 |
| 2015 | $1,853 | $220,693 | $32,500 | $188,193 |
| 2014 | $1,853 | $220,693 | $32,500 | $188,193 |
| 2013 | -- | $220,693 | $32,500 | $188,193 |
Source: Public Records
Map
Nearby Homes
- 6049 Mulberry Ln
- 6063 N Carolina 96
- 2665 Bodie Currin Rd
- 2605 Joe Pruitt Rd
- 616 Roxboro Rd
- 127 Daniel St
- 6035 Mary Lee Dr
- 200 W Westbury Dr
- 103 Alston Ct
- 609 N Country Club Dr
- 204 Cardinal Ct
- 206 Cardinal Ct
- 316 Keeneland Dr
- 735 Baker St
- 722 Baker St
- 6527 U S 15
- 611 College St
- 511 Broad St
- 96 North St
- 410 College St
- 3182 Keller Ln
- 3174 Keller Ln
- 3174 Keller Ln Unit 32
- 6103 Wild Cherry Ln
- 6105 Wild Cherry Ln
- 6101 Wild Cherry Ln
- 3179 Keller Ln
- 3179 Keller Ln Unit 35
- 3183 Keller Ln
- 3183 Keller Ln
- 6123 Wild Cherry Ln
- Lot 33 Keller Ln
- Lot 34 Keller Ln
- Lot 36 Keller Ln
- Lot 35 Keller Ln
- 3177 Keller Ln
- LOT 37 Keller Ln
- 3177 Keller Ln Unit 34
- Lot 35 Keller Ln Unit 35
- Lot 33 Keller Ln Unit 33