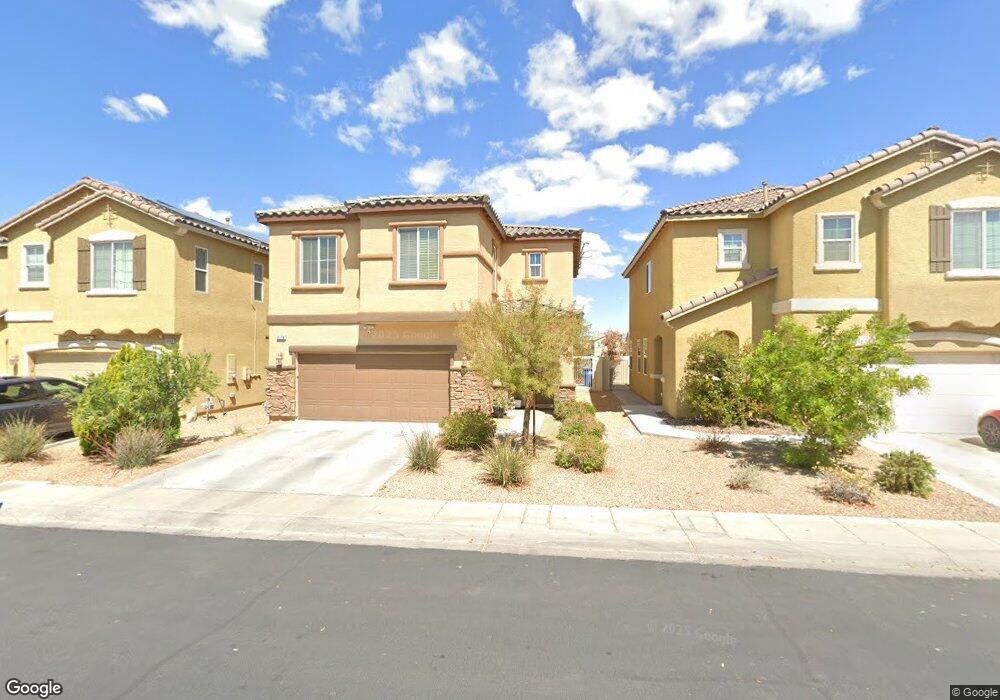
3178 Varenna Ridge Ave Las Vegas, NV 89141
Southern Highlands NeighborhoodEstimated Value: $450,000 - $474,000
3
Beds
3
Baths
1,824
Sq Ft
$252/Sq Ft
Est. Value
About This Home
This home is located at 3178 Varenna Ridge Ave, Las Vegas, NV 89141 and is currently estimated at $459,909, approximately $252 per square foot. 3178 Varenna Ridge Ave is a home located in Clark County with nearby schools including Dennis Ortwein Elementary, Lois & Jerry Tarkanian Middle School, and Desert Oasis High School.
Ownership History
Date
Name
Owned For
Owner Type
Purchase Details
Closed on
Apr 7, 2025
Sold by
Ponce Armando J and Ponce Elvira B
Bought by
Ding And Elvie Living Trust and Ponce
Current Estimated Value
Purchase Details
Closed on
May 27, 2011
Sold by
Richmond American Homes Of Nevada Inc
Bought by
Ponce Armando J and Ponce Elvira B
Home Financials for this Owner
Home Financials are based on the most recent Mortgage that was taken out on this home.
Original Mortgage
$168,835
Interest Rate
4.25%
Mortgage Type
FHA
Purchase Details
Closed on
Oct 21, 2009
Sold by
Pebble Creek Llc
Bought by
Richmond American Homes Of Nevada Inc
Purchase Details
Closed on
Mar 27, 2008
Sold by
Richmond American Homes Of Nevada Inc
Bought by
Pebble Creek Llc
Home Financials for this Owner
Home Financials are based on the most recent Mortgage that was taken out on this home.
Original Mortgage
$3,912,300
Interest Rate
5.72%
Mortgage Type
Seller Take Back
Create a Home Valuation Report for This Property
The Home Valuation Report is an in-depth analysis detailing your home's value as well as a comparison with similar homes in the area
Home Values in the Area
Average Home Value in this Area
Purchase History
| Date | Buyer | Sale Price | Title Company |
|---|---|---|---|
| Ding And Elvie Living Trust | -- | None Listed On Document | |
| Ponce Armando J | $173,227 | Ticor Title Las Vegas | |
| Richmond American Homes Of Nevada Inc | $3,402,000 | Nevada Title Las Vegas | |
| Pebble Creek Llc | $5,589,000 | Chicago Title |
Source: Public Records
Mortgage History
| Date | Status | Borrower | Loan Amount |
|---|---|---|---|
| Previous Owner | Ponce Armando J | $168,835 | |
| Previous Owner | Pebble Creek Llc | $3,912,300 |
Source: Public Records
Tax History Compared to Growth
Tax History
| Year | Tax Paid | Tax Assessment Tax Assessment Total Assessment is a certain percentage of the fair market value that is determined by local assessors to be the total taxable value of land and additions on the property. | Land | Improvement |
|---|---|---|---|---|
| 2025 | $1,764 | $126,449 | $43,050 | $83,399 |
| 2024 | $1,713 | $126,449 | $43,050 | $83,399 |
| 2023 | $1,713 | $116,675 | $38,500 | $78,175 |
| 2022 | $1,663 | $100,247 | $29,050 | $71,197 |
| 2021 | $1,615 | $94,337 | $26,950 | $67,387 |
| 2020 | $1,565 | $91,817 | $25,200 | $66,617 |
| 2019 | $1,519 | $88,053 | $22,750 | $65,303 |
| 2018 | $1,475 | $80,445 | $18,200 | $62,245 |
| 2017 | $2,335 | $79,612 | $16,800 | $62,812 |
| 2016 | $1,398 | $58,710 | $12,600 | $46,110 |
| 2015 | $1,394 | $61,599 | $12,600 | $48,999 |
| 2014 | $1,351 | $53,527 | $7,000 | $46,527 |
Source: Public Records
Map
Nearby Homes
- 3311 Fico Ave
- 3438 Bella Lante Ave
- 10991 Sardinia Sands Dr
- 11009 Deluna St
- 10997 Sardinia Sands Dr
- 3143 Leonetti Ct
- 3074 Binaggio Ct
- 3004 Binaggio Ct
- 3591 Bella Sovana Ct
- 3670 Sanucci Ct
- 10918 Avenzano St
- 3711 Lodina Ct
- 3760 Lodina Ct
- 11036 Parete Ct
- 3783 Lodina Ct
- 3792 Lodina Ct
- 11075 Alora St
- 0 Cactus Unit 2541249
- 10902 Pentland Downs St
- 11156 Tuscolana St
- 3192 Varenna Ridge Ave
- 3164 Varenna Ridge Ave
- 10791 Ascona Tide Ct
- 3148 Varenna Ridge Ave
- 10785 Ascona Tide Ct
- 3132 Varenna Ridge Ave
- 3177 Varenna Ridge Ave
- 10792 Ascona Tide Ct
- 3163 Varenna Ridge Ave
- 3191 Varenna Ridge Ave
- 3147 Varenna Ridge Ave
- 10786 Ascona Tide Ct
- 10779 Ascona Tide Ct
- 3116 Varenna Ridge Ave
- 3131 Varenna Ridge Ave
- 10780 Ascona Tide Ct
- 10773 Ascona Tide Ct
- 10793 Villa Carlotta Ct
- 3100 Varenna Ridge Ave
- 3115 Varenna Ridge Ave