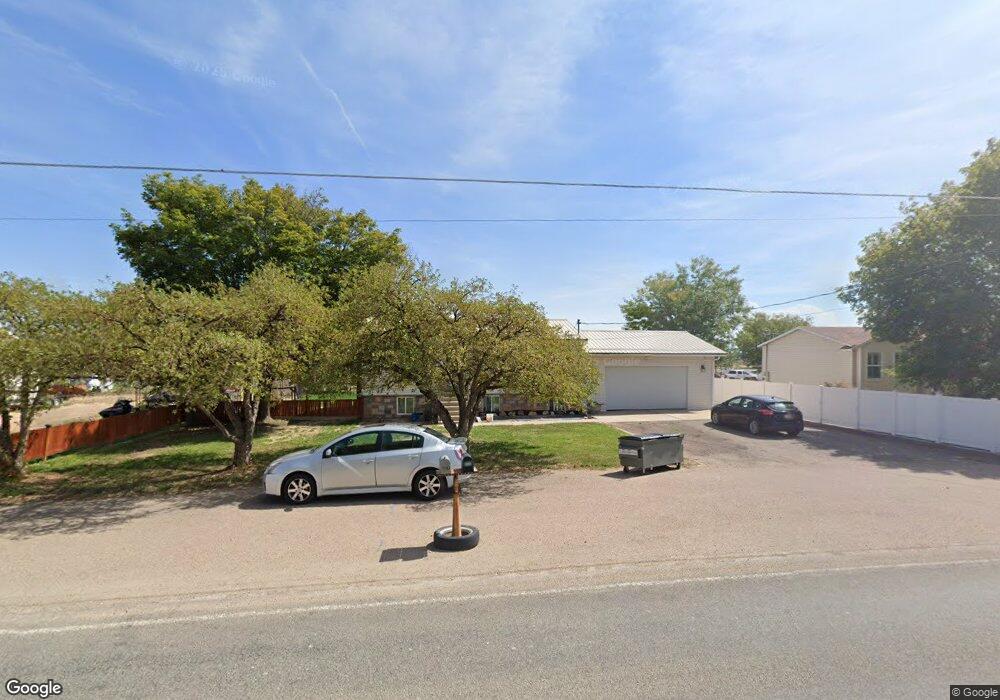
3179 S 500 E Vernal, UT 84078
Estimated Value: $301,000 - $354,000
4
Beds
2
Baths
1,886
Sq Ft
$175/Sq Ft
Est. Value
About This Home
This home is located at 3179 S 500 E, Vernal, UT 84078 and is currently estimated at $329,156, approximately $174 per square foot. 3179 S 500 E is a home located in Uintah County with nearby schools including Davis School, Vernal Middle School, and Uintah Middle School.
Ownership History
Date
Name
Owned For
Owner Type
Purchase Details
Closed on
Jan 21, 2022
Sold by
Gregory Ryan J and Gregory Casey Jean
Bought by
Anderson Tama Stevens
Current Estimated Value
Home Financials for this Owner
Home Financials are based on the most recent Mortgage that was taken out on this home.
Original Mortgage
$260,200
Outstanding Balance
$236,842
Interest Rate
3.11%
Mortgage Type
FHA
Estimated Equity
$92,314
Purchase Details
Closed on
Oct 6, 2017
Sold by
Miles Quinn and Miles Letha Jean
Bought by
Gregory Ryan J and Gregory Casey Jean
Purchase Details
Closed on
Feb 28, 2007
Sold by
Lance Kyle D and Lance Kerry Ann
Bought by
Miles Quinn and Miles Letha Jean
Home Financials for this Owner
Home Financials are based on the most recent Mortgage that was taken out on this home.
Original Mortgage
$212,800
Interest Rate
6.29%
Mortgage Type
New Conventional
Create a Home Valuation Report for This Property
The Home Valuation Report is an in-depth analysis detailing your home's value as well as a comparison with similar homes in the area
Purchase History
We collect this data history from publicly available records. To have your information removed, we recommend requesting removal directly through your county’s website.
| Date | Buyer | Sale Price | Title Company |
|---|---|---|---|
| Anderson Tama Stevens | -- | Basin Land Title | |
| Anderson Tama Stevens | -- | Basin Land Title | |
| Gregory Ryan J | -- | C& R Title | |
| Miles Quinn | -- | -- |
Source: Public Records
Mortgage History
We collect this data history from publicly available records. To have your information removed, we recommend requesting removal directly through your county’s website.
| Date | Status | Borrower | Loan Amount |
|---|---|---|---|
| Open | Anderson Tama Stevens | $260,200 | |
| Closed | Anderson Tama Stevens | $260,200 | |
| Previous Owner | Miles Quinn | $212,800 |
Source: Public Records
Tax History
| Year | Tax Paid | Tax Assessment Tax Assessment Total Assessment is a certain percentage of the fair market value that is determined by local assessors to be the total taxable value of land and additions on the property. | Land | Improvement |
|---|---|---|---|---|
| 2025 | $1,322 | $160,194 | $20,446 | $139,748 |
| 2024 | $1,322 | $152,460 | $18,087 | $134,373 |
| 2023 | $1,281 | $123,892 | $18,087 | $105,805 |
| 2022 | $1,060 | $102,731 | $18,087 | $84,644 |
| 2021 | $1,114 | $48,743 | $9,948 | $38,795 |
| 2020 | $1,153 | $94,156 | $19,250 | $74,906 |
| 2019 | $1,106 | $89,255 | $19,250 | $70,005 |
| 2018 | $1,063 | $85,922 | $19,250 | $66,672 |
| 2017 | $10 | $85,922 | $19,250 | $66,672 |
| 2016 | $972 | $86,260 | $19,250 | $67,010 |
| 2015 | $908 | $87,475 | $19,250 | $68,225 |
| 2014 | $864 | $84,226 | $19,250 | $64,976 |
| 2013 | $883 | $84,226 | $19,250 | $64,976 |
Source: Public Records
Map
Nearby Homes
Your Personal Tour Guide
Ask me questions while you tour the home.