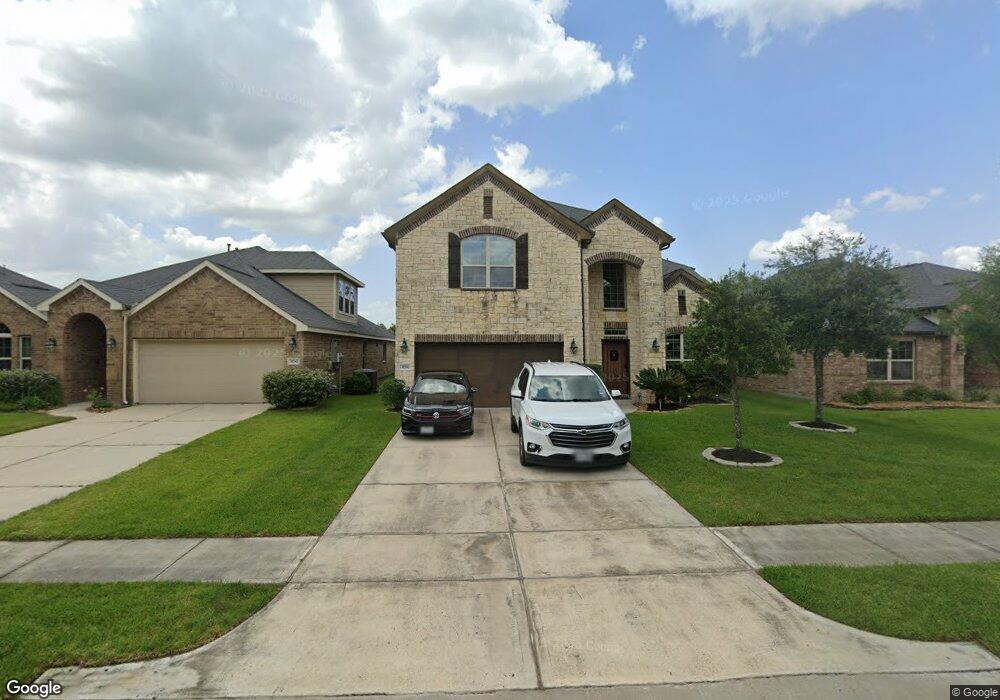
31791 Chapel Rock Ln Spring, TX 77386
Imperial Oaks NeighborhoodEstimated Value: $367,086 - $411,000
--
Bed
1
Bath
2,574
Sq Ft
$153/Sq Ft
Est. Value
About This Home
This home is located at 31791 Chapel Rock Ln, Spring, TX 77386 and is currently estimated at $394,772, approximately $153 per square foot. 31791 Chapel Rock Ln is a home with nearby schools including Birnham Woods Elementary School, York J High School, and Grand Oaks High School.
Ownership History
Date
Name
Owned For
Owner Type
Purchase Details
Closed on
Aug 9, 2017
Sold by
Longinos Ramevel
Bought by
Zerna Quennie
Current Estimated Value
Home Financials for this Owner
Home Financials are based on the most recent Mortgage that was taken out on this home.
Original Mortgage
$240,562
Outstanding Balance
$200,730
Interest Rate
3.96%
Mortgage Type
FHA
Estimated Equity
$194,042
Purchase Details
Closed on
Apr 30, 2015
Sold by
Lennar Homes Of Texas Sales And Mktg Ltd
Bought by
Zerna Quennie and Longinos Ramevel
Home Financials for this Owner
Home Financials are based on the most recent Mortgage that was taken out on this home.
Original Mortgage
$245,706
Interest Rate
3.84%
Mortgage Type
FHA
Purchase Details
Closed on
Jul 16, 2014
Sold by
Imperial Oaks Development Corp
Bought by
Zerna Quennie and Ramevel Longinos
Create a Home Valuation Report for This Property
The Home Valuation Report is an in-depth analysis detailing your home's value as well as a comparison with similar homes in the area
Home Values in the Area
Average Home Value in this Area
Purchase History
| Date | Buyer | Sale Price | Title Company |
|---|---|---|---|
| Zerna Quennie | -- | First American Title | |
| Zerna Quennie | -- | Nat | |
| Lennar Homes Of Texas Sales And Mktg Ltd | -- | North American Title Co | |
| Zerna Quennie | -- | -- |
Source: Public Records
Mortgage History
| Date | Status | Borrower | Loan Amount |
|---|---|---|---|
| Open | Zerna Quennie | $240,562 | |
| Previous Owner | Zerna Quennie | $245,706 |
Source: Public Records
Tax History Compared to Growth
Tax History
| Year | Tax Paid | Tax Assessment Tax Assessment Total Assessment is a certain percentage of the fair market value that is determined by local assessors to be the total taxable value of land and additions on the property. | Land | Improvement |
|---|---|---|---|---|
| 2025 | $7,781 | $393,987 | $68,000 | $325,987 |
| 2024 | $7,170 | $364,419 | -- | -- |
| 2023 | $7,170 | $331,290 | $68,000 | $319,600 |
| 2022 | $8,508 | $301,170 | $27,600 | $330,910 |
| 2021 | $8,402 | $273,790 | $27,600 | $246,190 |
| 2020 | $8,337 | $256,970 | $27,600 | $229,370 |
| 2019 | $8,730 | $261,830 | $27,600 | $234,230 |
| 2018 | $7,545 | $244,500 | $27,600 | $216,900 |
| 2017 | $8,219 | $244,500 | $27,600 | $216,900 |
| 2016 | $8,219 | $244,500 | $27,600 | $216,900 |
| 2015 | -- | $27,600 | $27,600 | $0 |
Source: Public Records
Map
Nearby Homes
- 31851 Chapel Rock Ln
- 31767 Chapel Rock Ln
- 32414 Poplar Grove Ln
- 31727 Serrano Bluff Ln
- 3566 Hamilton Bend Ln
- 3216 Bright Maple Dr
- 3260 Bright Maple Dr
- 32419 Poplar Grove Ln
- 32418 Poplar Grove Ln
- 31739 Dover Oaks Ln
- 3412 Chestnut Colony Ct
- 32411 Poplar Grove Ln
- Cypress Plan at The Meadows at Imperial Oaks - 50ft
- Hamilton Plan at The Meadows at Imperial Oaks - 50ft
- Tyler Plan at The Meadows at Imperial Oaks - 50ft
- Dawson Plan at The Meadows at Imperial Oaks - 50ft
- Katy Plan at The Meadows at Imperial Oaks - 50ft
- Cheyenne Plan at The Meadows at Imperial Oaks - 50ft
- Joshua Plan at The Meadows at Imperial Oaks - 50ft
- 32427 Poplar Grove Ln
- 31795 Chapel Rock Ln
- 31787 Chapel Rock Ln
- 31783 Chapel Rock Ln
- 31799 Chapel Rock Ln
- 31792 Chapel Rock Ln
- 31803 Chapel Rock Ln
- 31779 Chapel Rock Ln
- 31784 Chapel Rock Ln
- 31778 Chapel Rock Ln
- 31788 Chapel Rock Ln
- 31807 Chapel Rock Ln
- 31806 Chapel Rock Ln
- 31775 Chapel Rock Ln
- 31811 Chapel Rock Ln
- 31774 Chapel Rock Ln
- 31810 Chapel Rock Ln
- 31815 Chapel Rock Ln
- 31731 Breezy Retreat Ct
- 31726 Breezy Retreat Ct
- 31819 Chapel Rock Ln