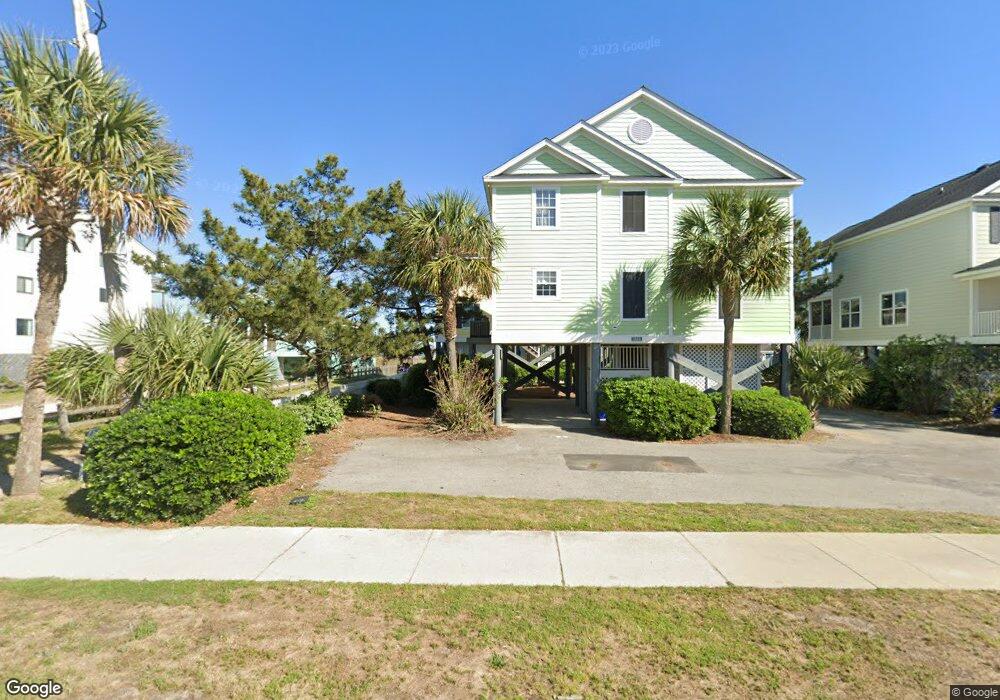
317B N Ocean Blvd Unit SB Surfside Beach, SC 29575
Estimated Value: $1,219,000 - $1,411,000
3
Beds
3
Baths
1,828
Sq Ft
$734/Sq Ft
Est. Value
About This Home
This home is located at 317B N Ocean Blvd Unit SB, Surfside Beach, SC 29575 and is currently estimated at $1,342,618, approximately $734 per square foot. 317B N Ocean Blvd Unit SB is a home located in Horry County with nearby schools including Seaside Elementary, St. James Intermediate, and St. James Middle School.
Ownership History
Date
Name
Owned For
Owner Type
Purchase Details
Closed on
Aug 11, 2017
Sold by
317B North Ocean Blvd Llc
Bought by
Mulieri Family Llc
Current Estimated Value
Purchase Details
Closed on
Jan 2, 2013
Sold by
Lien Justine
Bought by
Num 317B North Ocean Blvd Llc
Purchase Details
Closed on
Jun 19, 2008
Sold by
Robert Michael R
Bought by
Lien William J and Lien Justine
Purchase Details
Closed on
Jan 14, 2005
Sold by
Hughes Roland G and Hughes Mary S
Bought by
Robert Michael R
Home Financials for this Owner
Home Financials are based on the most recent Mortgage that was taken out on this home.
Original Mortgage
$86,900
Interest Rate
5.62%
Mortgage Type
Credit Line Revolving
Purchase Details
Closed on
Apr 23, 2001
Sold by
Blakey David Neal and Blakey Karen Anne
Bought by
Hughes Roland G and Hughes Mary S
Purchase Details
Closed on
Jan 5, 2000
Sold by
Daley Frances R
Bought by
Blakey David Neal and Blakey Karen Anne
Create a Home Valuation Report for This Property
The Home Valuation Report is an in-depth analysis detailing your home's value as well as a comparison with similar homes in the area
Home Values in the Area
Average Home Value in this Area
Purchase History
| Date | Buyer | Sale Price | Title Company |
|---|---|---|---|
| Mulieri Family Llc | $550,000 | -- | |
| Num 317B North Ocean Blvd Llc | -- | -- | |
| Lien William J | $1,075,000 | -- | |
| Robert Michael R | $869,000 | -- | |
| Hughes Roland G | $527,000 | -- | |
| Blakey David Neal | $440,000 | -- |
Source: Public Records
Mortgage History
| Date | Status | Borrower | Loan Amount |
|---|---|---|---|
| Previous Owner | Robert Michael R | $86,900 | |
| Previous Owner | Robert Michael R | $608,300 |
Source: Public Records
Tax History Compared to Growth
Tax History
| Year | Tax Paid | Tax Assessment Tax Assessment Total Assessment is a certain percentage of the fair market value that is determined by local assessors to be the total taxable value of land and additions on the property. | Land | Improvement |
|---|---|---|---|---|
| 2024 | $8,611 | $40,088 | $21,771 | $18,317 |
| 2023 | $8,611 | $34,625 | $19,817 | $14,808 |
| 2021 | $7,850 | $34,625 | $19,817 | $14,808 |
| 2020 | $7,763 | $34,625 | $19,817 | $14,808 |
| 2019 | $7,763 | $34,625 | $19,817 | $14,808 |
| 2018 | $7,546 | $32,572 | $21,514 | $11,058 |
| 2017 | $6,124 | $26,425 | $15,367 | $11,058 |
| 2016 | -- | $26,425 | $15,367 | $11,058 |
| 2015 | $6,124 | $26,426 | $15,368 | $11,058 |
| 2014 | $5,931 | $26,426 | $15,368 | $11,058 |
Source: Public Records
Map
Nearby Homes
- 416 N Ocean Blvd Unit E-19
- 416 N Ocean Blvd Unit D-14
- 317 A N Ocean Blvd
- 421 Myrtle Oak Dr
- 310 3rd Ave N Unit F-3
- 119 6th Ave N
- 310 5th Ave N Unit 206 Sea Grove
- 310 5th Ave N Unit 204
- 310 5th Ave N Unit 302 Sea Grove
- 112 7th Ave N Unit "Saltaire II"
- 115 8th Ave N
- 811 N Ocean Blvd Unit 203
- 114 N Pinewood Dr
- 813 N Ocean Blvd Unit B
- 22 N Ocean Blvd
- 511 7th Ave N
- 327 A&B Sparrow Dr
- 311 Surfside Dr
- 1023 S Seabridge Ct
- 410 5th Ave N
- 317 B N Ocean Blvd
- 317B N Ocean Blvd Unit Portofino II, 317B
- 317B N Ocean Blvd Unit 317-B Portofino II
- 317A N Ocean Blvd
- 317-A N Ocean Blvd
- 317 N Ocean Blvd Unit "Portofino II 317-A"
- 317 N Ocean Blvd
- 317 N Ocean Blvd Unit A
- 317C N Ocean Blvd
- 411 N Ocean Blvd
- 315B N Ocean Blvd
- 315A N Ocean Blvd
- 315-A N Ocean Blvd
- 315 N Ocean Blvd Unit 315-A Portofino II
- 315 N Ocean Blvd
- 313 N Ocean Blvd Unit 313-A PORTOFINO II
- 313 N Ocean Blvd
- 313A N Ocean Blvd
- 313-A N Ocean Blvd Unit 313-A PORTOFINO II
- 313-A N Ocean Blvd