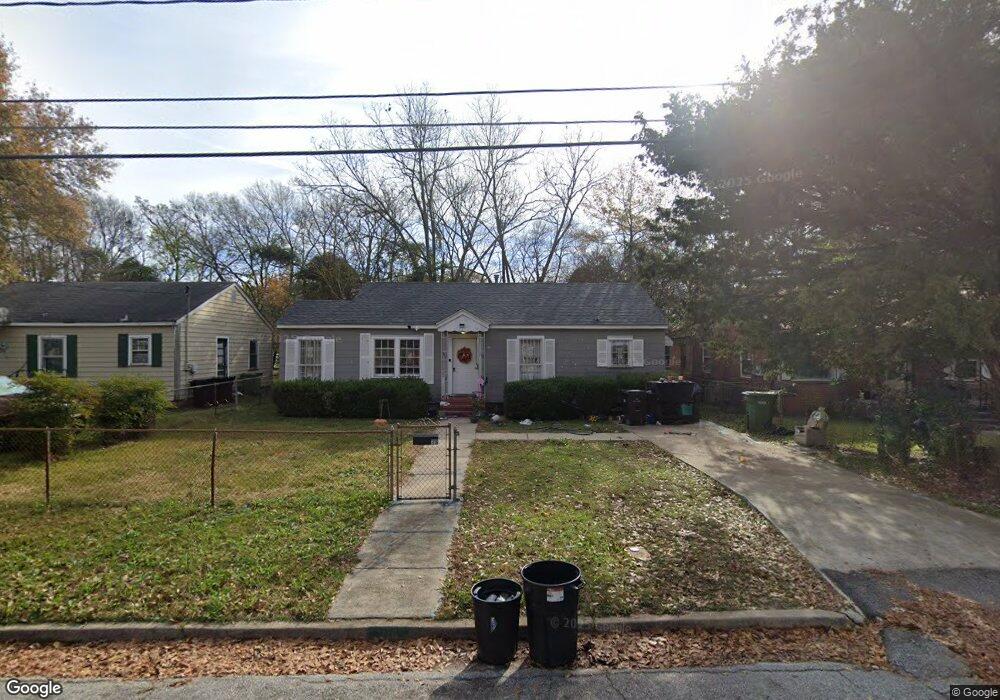
318 31st Ave 0 Columbus, GA 31903
Southern Columbus NeighborhoodEstimated Value: $50,000 - $55,000
2
Beds
2
Baths
1,094
Sq Ft
$47/Sq Ft
Est. Value
About This Home
This home is located at 318 31st Ave 0, Columbus, GA 31903 and is currently estimated at $51,708, approximately $47 per square foot. 318 31st Ave 0 is a home located in Muscogee County with nearby schools including Martin Luther King Jr. Elementary School, Baker Middle School, and Carver High School.
Ownership History
Date
Name
Owned For
Owner Type
Purchase Details
Closed on
Aug 8, 2023
Sold by
National Premier Investments Llc
Bought by
Moham Ramadan Nidaa Hassan
Current Estimated Value
Purchase Details
Closed on
Dec 28, 2018
Sold by
Honradez Investment Grp Llc
Bought by
National Premier Investments Llc
Purchase Details
Closed on
May 12, 2017
Bought by
Honradez Investment Grp Llc
Purchase Details
Closed on
Jan 3, 2017
Sold by
Jones Normal A
Bought by
Cr Suisse First Boston Mtg Sec
Create a Home Valuation Report for This Property
The Home Valuation Report is an in-depth analysis detailing your home's value as well as a comparison with similar homes in the area
Home Values in the Area
Average Home Value in this Area
Purchase History
| Date | Buyer | Sale Price | Title Company |
|---|---|---|---|
| Moham Ramadan Nidaa Hassan | $47,000 | None Listed On Document | |
| National Premier Investments Llc | $6,000 | -- | |
| Honradez Investment Grp Llc | $8,000 | -- | |
| Cr Suisse First Boston Mtg Sec | $28,090 | -- |
Source: Public Records
Tax History Compared to Growth
Tax History
| Year | Tax Paid | Tax Assessment Tax Assessment Total Assessment is a certain percentage of the fair market value that is determined by local assessors to be the total taxable value of land and additions on the property. | Land | Improvement |
|---|---|---|---|---|
| 2025 | $736 | $18,800 | $2,640 | $16,160 |
| 2024 | $736 | $18,800 | $2,640 | $16,160 |
| 2023 | $765 | $19,408 | $3,144 | $16,264 |
| 2022 | $692 | $16,960 | $3,144 | $13,816 |
| 2021 | $641 | $15,656 | $3,144 | $12,512 |
| 2020 | $639 | $15,656 | $3,144 | $12,512 |
| 2019 | $98 | $2,400 | $440 | $1,960 |
| 2018 | $645 | $15,748 | $3,144 | $12,604 |
| 2017 | $742 | $15,748 | $3,144 | $12,604 |
| 2016 | $7 | $10,919 | $1,928 | $8,991 |
| 2015 | $7 | $10,919 | $1,928 | $8,991 |
| 2014 | $7 | $10,919 | $1,928 | $8,991 |
| 2013 | -- | $10,919 | $1,928 | $8,991 |
Source: Public Records
Map
Nearby Homes