Estimated Value: $85,000 - $133,000
3
Beds
2
Baths
1,828
Sq Ft
$65/Sq Ft
Est. Value
About This Home
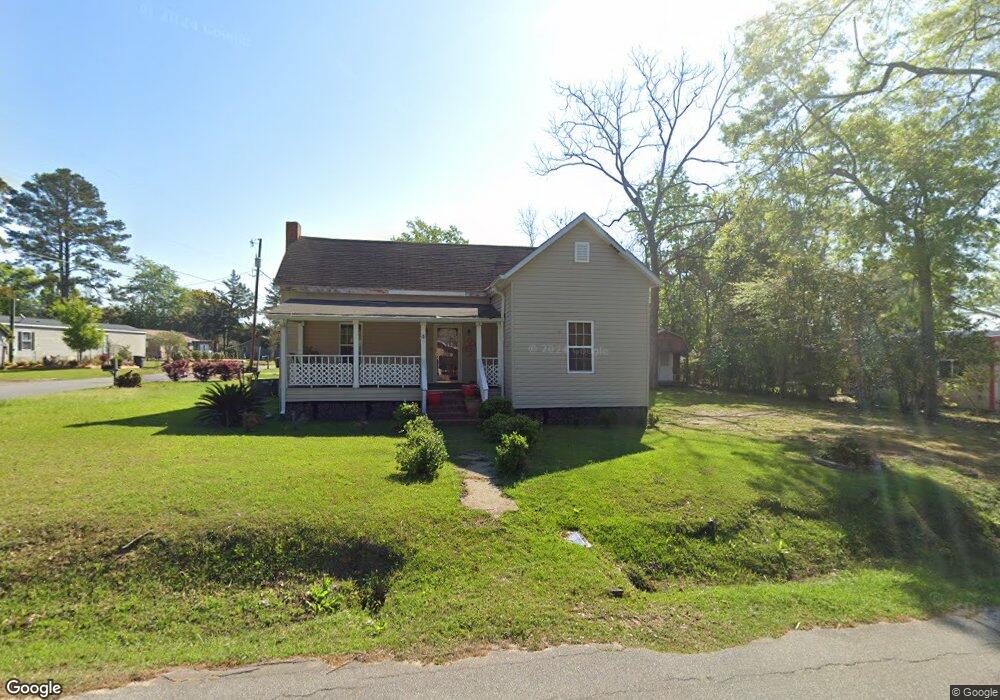
This home is located at 318 4th St NE, Cairo, GA 39828 and is currently estimated at $118,159, approximately $64 per square foot. 318 4th St NE is a home located in Grady County with nearby schools including Cairo High School.
Ownership History
Date
Name
Owned For
Owner Type
Purchase Details
Closed on
Sep 25, 2007
Sold by
Blc Investments Inc
Bought by
Jones Rosell
Current Estimated Value
Home Financials for this Owner
Home Financials are based on the most recent Mortgage that was taken out on this home.
Original Mortgage
$76,050
Interest Rate
6.41%
Mortgage Type
New Conventional
Purchase Details
Closed on
Apr 21, 2006
Sold by
Mikes Rentals Llc
Bought by
Ponder Michael Glenn and Ponder Christie L
Purchase Details
Closed on
Jan 31, 2006
Sold by
Ponder Michael Glenn
Bought by
Blc Investments Inc
Purchase Details
Closed on
Oct 12, 2005
Sold by
Cm Stone Bridge
Bought by
Mikes Rentals Llc
Purchase Details
Closed on
Jan 29, 2003
Sold by
Hughes Charles V
Bought by
Cm Stone Bridge
Purchase Details
Closed on
Jul 3, 2002
Sold by
Pearson Arnold
Bought by
Hughes Charles V
Purchase Details
Closed on
Jul 11, 1986
Bought by
Pearson Arnold
Create a Home Valuation Report for This Property
The Home Valuation Report is an in-depth analysis detailing your home's value as well as a comparison with similar homes in the area
Home Values in the Area
Average Home Value in this Area
Purchase History
| Date | Buyer | Sale Price | Title Company |
|---|---|---|---|
| Jones Rosell | $84,500 | -- | |
| Ponder Michael Glenn | $8,000 | -- | |
| Blc Investments Inc | -- | -- | |
| Mikes Rentals Llc | $213,400 | -- | |
| Cm Stone Bridge | -- | -- | |
| Hughes Charles V | $135,000 | -- | |
| Pearson Arnold | -- | -- |
Source: Public Records
Mortgage History
| Date | Status | Borrower | Loan Amount |
|---|---|---|---|
| Closed | Jones Rosell | $76,050 |
Source: Public Records
Tax History Compared to Growth
Tax History
| Year | Tax Paid | Tax Assessment Tax Assessment Total Assessment is a certain percentage of the fair market value that is determined by local assessors to be the total taxable value of land and additions on the property. | Land | Improvement |
|---|---|---|---|---|
| 2024 | $1,516 | $39,993 | $1,920 | $38,073 |
| 2023 | $1,255 | $35,557 | $2,661 | $32,896 |
| 2022 | $1,308 | $35,557 | $2,661 | $32,896 |
| 2021 | $1,311 | $35,557 | $2,661 | $32,896 |
| 2020 | $1,314 | $35,557 | $2,661 | $32,896 |
| 2019 | $1,314 | $35,557 | $2,661 | $32,896 |
| 2018 | $1,250 | $35,557 | $2,661 | $32,896 |
| 2017 | $1,203 | $35,557 | $2,661 | $32,896 |
| 2016 | $1,035 | $30,153 | $2,661 | $27,492 |
| 2015 | $1,025 | $30,153 | $2,661 | $27,492 |
| 2014 | $1,025 | $30,153 | $2,661 | $27,492 |
| 2013 | -- | $27,309 | $2,661 | $24,648 |
Source: Public Records
Map
Nearby Homes
- 4761 Hadley Ferry Rd
- 711 2nd Ave NE
- 2975 U S 84
- X 1st St
- 00 Hwy 111 South Tract 1
- 316,322 NW 1st St + Lot
- 0 1st St
- 309 3rd St SE
- 00 NW 9th Ave
- 125 6th Ave NW
- 00 00 Hwy 111 South Tract 2
- 471 4th St SE
- 481 4th St SE
- 000 S Broad St
- 220 8th Ave NW
- 602 4th St SE
- 000 Hwy 111 South 20 59 Acres
- 530 6th Ave SE
- 40 5th Ave SW
- 27 6th Ave SW