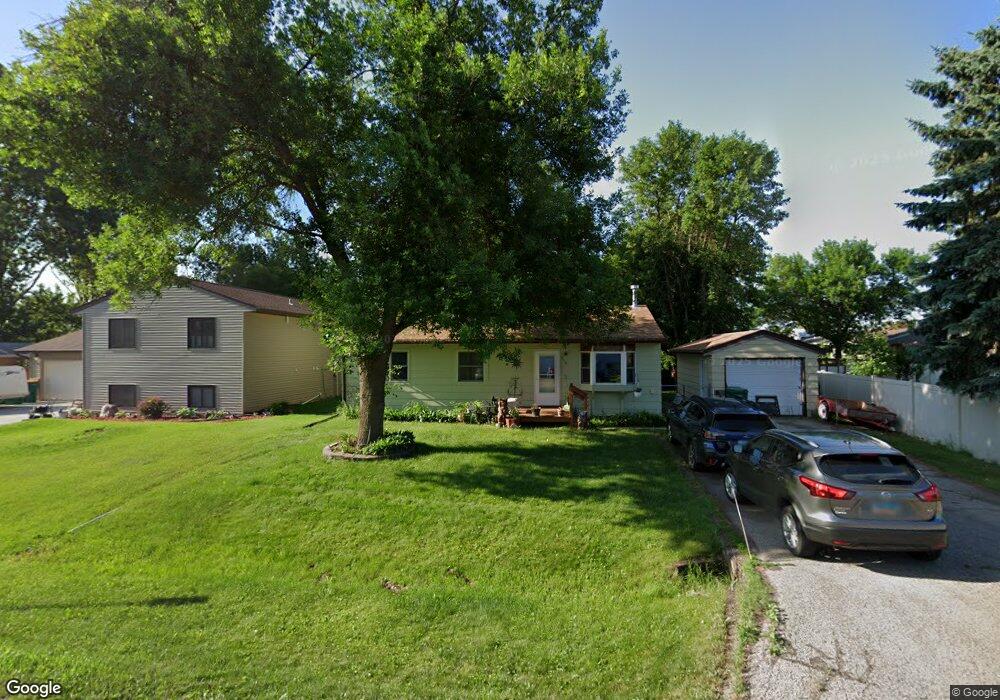
318 5th St Mapleton, ND 58059
Estimated Value: $227,000 - $258,000
3
Beds
1
Bath
1,040
Sq Ft
$233/Sq Ft
Est. Value
About This Home
This home is located at 318 5th St, Mapleton, ND 58059 and is currently estimated at $242,412, approximately $233 per square foot. 318 5th St is a home located in Cass County with nearby schools including Mapleton Elementary School.
Ownership History
Date
Name
Owned For
Owner Type
Purchase Details
Closed on
Jul 28, 2022
Sold by
Dabbert Custom Homes Llc
Bought by
Brown Christopher and Brown Sarah
Current Estimated Value
Home Financials for this Owner
Home Financials are based on the most recent Mortgage that was taken out on this home.
Original Mortgage
$409,385
Outstanding Balance
$391,976
Interest Rate
5.7%
Mortgage Type
VA
Estimated Equity
-$149,564
Purchase Details
Closed on
Oct 5, 2021
Sold by
Rivers Edge Estates Llc
Bought by
Dabbert Custom Homes Llc
Home Financials for this Owner
Home Financials are based on the most recent Mortgage that was taken out on this home.
Original Mortgage
$76,471
Interest Rate
2.8%
Mortgage Type
Construction
Create a Home Valuation Report for This Property
The Home Valuation Report is an in-depth analysis detailing your home's value as well as a comparison with similar homes in the area
Purchase History
| Date | Buyer | Sale Price | Title Company |
|---|---|---|---|
| Brown Christopher | $408,261 | The Title Company | |
| Dabbert Custom Homes Llc | -- | None Listed On Document |
Source: Public Records
Mortgage History
| Date | Status | Borrower | Loan Amount |
|---|---|---|---|
| Open | Brown Christopher | $409,385 | |
| Previous Owner | Dabbert Custom Homes Llc | $76,471 |
Source: Public Records
Tax History
| Year | Tax Paid | Tax Assessment Tax Assessment Total Assessment is a certain percentage of the fair market value that is determined by local assessors to be the total taxable value of land and additions on the property. | Land | Improvement |
|---|---|---|---|---|
| 2024 | $2,598 | $96,150 | $18,850 | $77,300 |
| 2023 | $3,036 | $95,650 | $18,850 | $76,800 |
| 2022 | $2,664 | $88,100 | $18,850 | $69,250 |
| 2021 | $2,509 | $79,250 | $14,600 | $64,650 |
| 2020 | $2,404 | $77,000 | $14,600 | $62,400 |
| 2019 | $2,395 | $77,000 | $14,600 | $62,400 |
| 2018 | $2,419 | $77,000 | $14,600 | $62,400 |
| 2017 | $2,247 | $76,300 | $14,600 | $61,700 |
| 2016 | $1,288 | $63,000 | $7,150 | $55,850 |
| 2015 | $1,138 | $58,300 | $6,600 | $51,700 |
| 2014 | $1,094 | $53,000 | $6,000 | $47,000 |
| 2013 | $1,230 | $53,000 | $6,000 | $47,000 |
Source: Public Records
Map
Nearby Homes
Your Personal Tour Guide
Ask me questions while you tour the home.