Estimated Value: $139,000 - $160,000
4
Beds
1
Bath
2,559
Sq Ft
$59/Sq Ft
Est. Value
About This Home
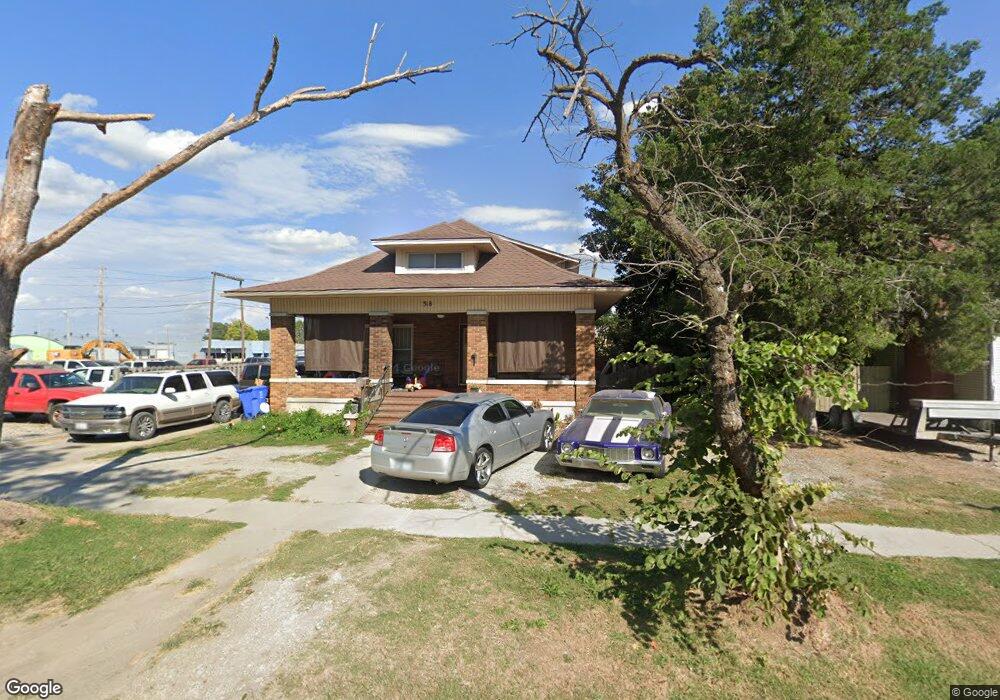
This home is located at 318 A St NW, Miami, OK 74354 and is currently estimated at $151,538, approximately $59 per square foot. 318 A St NW is a home located in Ottawa County with nearby schools including Miami High School and Mt. Olive Lutheran School.
Ownership History
Date
Name
Owned For
Owner Type
Purchase Details
Closed on
Apr 8, 2025
Sold by
Jarvis Kara and Sprenkle Kara
Bought by
Sprenkle Kara and Jarvis Matthew
Current Estimated Value
Purchase Details
Closed on
Feb 26, 2015
Sold by
Investors Independent Trust Co
Bought by
Jarvis Matthew A
Home Financials for this Owner
Home Financials are based on the most recent Mortgage that was taken out on this home.
Original Mortgage
$68,000
Interest Rate
3.68%
Mortgage Type
New Conventional
Create a Home Valuation Report for This Property
The Home Valuation Report is an in-depth analysis detailing your home's value as well as a comparison with similar homes in the area
Home Values in the Area
Average Home Value in this Area
Purchase History
| Date | Buyer | Sale Price | Title Company |
|---|---|---|---|
| Sprenkle Kara | $4,000 | None Listed On Document | |
| Sprenkle Kara | $4,000 | None Listed On Document | |
| Jarvis Matthew A | $85,000 | Ottawa County Abstract & Tit |
Source: Public Records
Mortgage History
| Date | Status | Borrower | Loan Amount |
|---|---|---|---|
| Previous Owner | Jarvis Matthew A | $68,000 |
Source: Public Records
Tax History Compared to Growth
Tax History
| Year | Tax Paid | Tax Assessment Tax Assessment Total Assessment is a certain percentage of the fair market value that is determined by local assessors to be the total taxable value of land and additions on the property. | Land | Improvement |
|---|---|---|---|---|
| 2025 | $955 | $11,232 | $588 | $10,644 |
| 2024 | $955 | $10,906 | $571 | $10,335 |
| 2023 | $955 | $10,588 | $570 | $10,018 |
| 2022 | $858 | $10,280 | $570 | $9,710 |
| 2021 | $849 | $9,981 | $570 | $9,411 |
| 2020 | $828 | $9,690 | $570 | $9,120 |
| 2019 | $787 | $10,588 | $570 | $10,018 |
| 2018 | $767 | $10,280 | $570 | $9,710 |
| 2017 | $755 | $9,981 | $570 | $9,411 |
| 2016 | $698 | $9,690 | $570 | $9,120 |
| 2015 | $322 | $3,628 | $465 | $3,163 |
| 2014 | $406 | $4,956 | $570 | $4,386 |
Source: Public Records
Map
Nearby Homes