
S
Seller's Agent in 2026
Steve Blier
Coldwell Banker Realty
(603) 930-5684
1 in this area
43 Total Sales

Estimated Value: $667,000 - $788,913
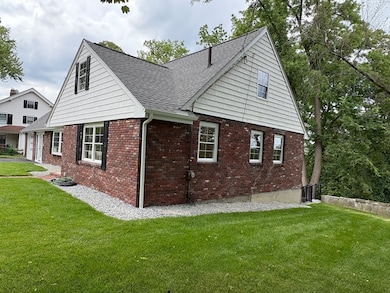
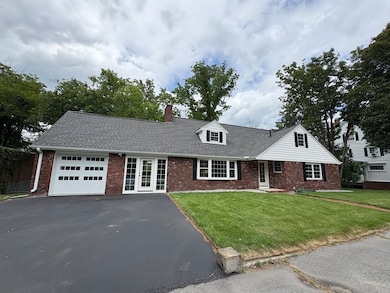
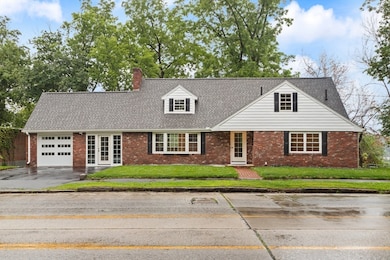
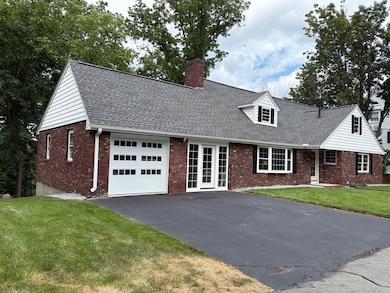
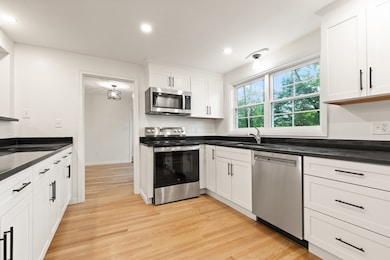
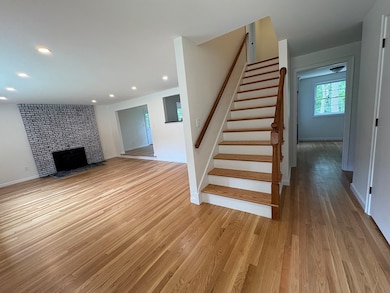
WOW LOWELL's BEST BUY just became even BETTER!!! Owner says sell now! OPEN HOUSE SUN? Great "Belvidere" Area Custom Ranch/Cape home, Wonderfully Updated and Remodeled! Owner/Seller's plans changed, now available for sale, ready for you to move right-in to ENJOY! Located in one of Lowell's most sought after location of other beautiful stately Homes! Beautiful Hardwood floors on 1st and 2nd floors, amazing work, attention to detail of this Fine Executive Home. Carefully and thoughtfully remodeled and improved! Bringing this Great Home back to life with all of today's Modern, Quality, Comforts and Conveniences! This large Beautiful eat-in Kitchen, Granite, new SS Appliances! A Great Floor Plan, offers a Primary first-floor bedroom with 3/4 bath, plus another first-floor bedroom and 2 huge bedrooms.+ full bath up. There is a lot of living space includes a huge finished basement for exercise rm. game rm. nice second family room with 2nd fireplace. (2 car gar. potential) Great river view!
We collect this data history from publicly available records. To have your information removed, we recommend requesting removal directly through your county’s website.
| Date | Buyer | Sale Price | Title Company |
|---|---|---|---|
| Rodgers Andre L | $700,000 | -- | |
| Contraros Robert J | $440,000 | None Available | |
| Contraros Robert J | $440,000 | None Available |
We collect this data history from publicly available records. To have your information removed, we recommend requesting removal directly through your county’s website.
| Date | Status | Borrower | Loan Amount |
|---|---|---|---|
| Open | Rodgers Andre L | $560,000 | |
| Previous Owner | Contraros Robert J | $440,000 |
| Date | Event | Price | List to Sale | Price per Sq Ft |
|---|---|---|---|---|
| 01/15/2026 01/15/26 | Sold | $700,000 | -1.4% | $198 / Sq Ft |
| 12/06/2025 12/06/25 | Pending | -- | -- | -- |
| 12/03/2025 12/03/25 | Price Changed | $709,900 | -2.7% | $201 / Sq Ft |
| 10/17/2025 10/17/25 | Price Changed | $729,900 | -2.7% | $206 / Sq Ft |
| 09/22/2025 09/22/25 | Price Changed | $749,900 | -5.1% | $212 / Sq Ft |
| 08/29/2025 08/29/25 | Price Changed | $789,900 | +1.3% | $223 / Sq Ft |
| 07/08/2025 07/08/25 | For Sale | $779,900 | -- | $221 / Sq Ft |
| Year | Tax Paid | Tax Assessment Tax Assessment Total Assessment is a certain percentage of the fair market value that is determined by local assessors to be the total taxable value of land and additions on the property. | Land | Improvement |
|---|---|---|---|---|
| 2025 | $7,208 | $627,900 | $264,000 | $363,900 |
| 2024 | $6,861 | $576,100 | $246,800 | $329,300 |
| 2023 | $6,673 | $537,300 | $214,600 | $322,700 |
| 2022 | $6,240 | $491,700 | $195,500 | $296,200 |
| 2021 | $5,866 | $435,800 | $170,300 | $265,500 |
| 2020 | $5,777 | $432,400 | $170,300 | $262,100 |
| 2019 | $5,914 | $421,200 | $169,400 | $251,800 |
| 2018 | $5,711 | $396,900 | $161,500 | $235,400 |
| 2017 | $5,643 | $378,200 | $149,800 | $228,400 |
| 2016 | $5,241 | $345,700 | $138,000 | $207,700 |
| 2015 | $5,745 | $371,100 | $138,000 | $233,100 |
| 2013 | $5,263 | $350,600 | $152,500 | $198,100 |
S
Seller's Agent in 2026
Steve Blier
Coldwell Banker Realty
(603) 930-5684
1 in this area
43 Total Sales
V
Buyer's Agent in 2026
Vladimir Laguerre
Chinatti Realty Group, Inc.
1 in this area
2 Total Sales
Source: MLS Property Information Network (MLS PIN)
MLS Number: 73401262
APN: LOWE-000218-000160-000318
Disclaimer: Certain information contained herein is derived from information provided by parties other than Homes.com. All information provided is deemed reliable, but is not guaranteed to be accurate and should be independently verified.
![]() The property listing data and information, or the Images, set forth herein were provided to MLS Property Information Network, Inc. from third party sources, including sellers, lessors and public records, and were compiled by MLS Property Information Network, Inc. The property listing data and information, and the Images, are for the personal, non-commercial use of consumers having a good faith interest in purchasing or leasing listed properties of the type displayed to them and may not be used for any purpose other than to identify prospective properties which such consumers may have a good faith interest in purchasing or leasing. MLS Property Information Network, Inc. and its subscribers disclaim any and all representations and warranties as to the accuracy of the property listing data and information, or as to the accuracy of any of the Images, set forth herein.
The property listing data and information, or the Images, set forth herein were provided to MLS Property Information Network, Inc. from third party sources, including sellers, lessors and public records, and were compiled by MLS Property Information Network, Inc. The property listing data and information, and the Images, are for the personal, non-commercial use of consumers having a good faith interest in purchasing or leasing listed properties of the type displayed to them and may not be used for any purpose other than to identify prospective properties which such consumers may have a good faith interest in purchasing or leasing. MLS Property Information Network, Inc. and its subscribers disclaim any and all representations and warranties as to the accuracy of the property listing data and information, or as to the accuracy of any of the Images, set forth herein.
Ask me questions while you tour the home.